
Over the past couple of weeks, there’s been some work by a few of us to #GiveFirst. I’ll share a little context but will get to the tech very quicker.
From March 3rd (2020), an event called Viz for Social Good with Sunny Street (click “here” for the eventbrite for some of the details) was being run. This was a virtual datathon “a data visualisation hackathon” being hosted by Frederic Fery for a company called Sunny Street. Also with what’s happening, the pitch event had gone virtual. I’ll add comments to this post as well get closer or to reflect on the outcomes. The virtual event is live on March 19th on zoom (https://zoom.us/j/9065708856) at 5pm AEST (+10 GMT).
(From the eventbrite) – Sunny Street is changing the world by providing heartfelt healthcare to our community’s most vulnerable people. We need to be able to clearly articulate our social impact to our stakeholders, collaborators and potential sponsors and funding sources. We know that our outreach clinics benefit the lives of our patients, volunteers and the broader community through our authentic conversation-based model of care. Sunny Street needs powerful visual data representation that captures the multi-faceted benefits of these therapeutic relationships from the dedicated time and generosity of our volunteers.
There’s good information about the data that they collect and ultimately the outcomes that they are looking for. If you are interested in the analysis itself about what I was able to find, you can find some of the resources here.
I’ve published an article on LinkedIn – https://bit.ly/3d3UF5F
I’ve published a quick video on Youtube – https://bit.ly/2QgTplC
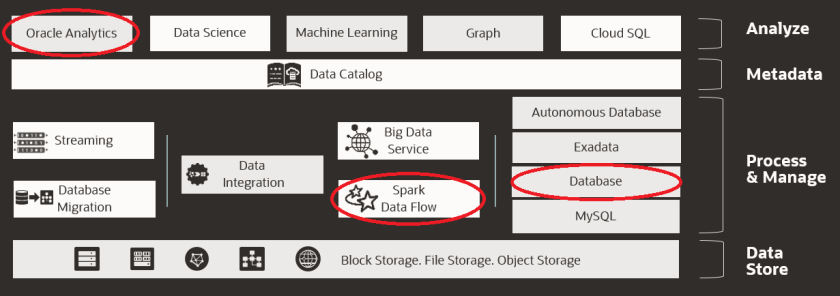
As a learning experience, it’s based upon our Data Platform Architecture.

There’s a few different categories of capability that we outline here:
- Data Store – the under-lying technologies where we store the data
- Process & Manage – the technologies in which we simplify the access, processing and also the securing of the data.
- Metadata – the technologies that helps our understanding of the data.
- Analyse – the technologies that helps us interact and gain insights from our data.
For this work, I focused primarily on the “Process & Manage” and “Analyse” capability.
For the rest of this article, let me step you through the lifecycle which ultimately was iterative however consists of three main steps – Discover, Hypothesis, Experiment.
Learning about the data
The data itself came in a CSV and XLS format which was fine. Some of the data came from a solution that GP’s use called Best Practice. The rest of the data came from a company called Cogniom from their product called TANDM (that digitise Time and Motion Studies – this is cool stuff).
With the data that was there, I needed to discover and draw conclusions about what data was available and what relationships was held in the data. Looking at the data in Excel was hard – you see the data but the relationships, aggregations and in one of the datasets there was over 200 columns of data. The natural thing for me to do was to start getting statistics on the data (aggregating – min, max, “recorded” vs “not recorded”).
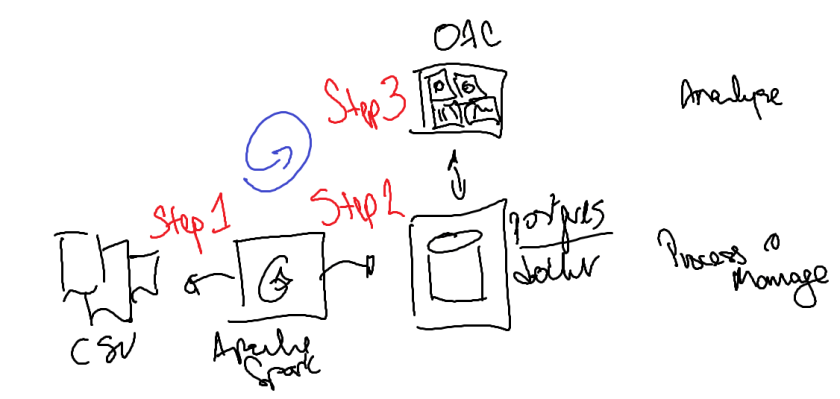
There’s three pieces of tech that I used for this bit.
I used Apache Spark to process (create datasets, manipulate the datatypes and representation and store the data somewhere) and then saved the datasets in a database.
I used postgres running in a docker container to store the data. It was simple enough to get up and going and I was able to save the dockerfile to install everything I needed. Having it in the database meant that it opened up the different options for me to access the data.
I used Oracle Analytics Cloud to analyse the data. There’s the cloud version as well as a Desktop (of which I used for this event). I used this visualise and augment the data to better understand what was available and how the data potentially intersected with each other to form hypotheses.
Here’s a diagram of what I used to achieve this (to Process & Manage the data as well as Analyse the data).
From that, I was able to start understanding more about the data. I could see relationships. I could see patterns. This was an iterative process of learning.
Learning about our actions (both past and future).
Even though the tech was the same, the purpose of learning from the analyse was different depending on the context – whether it was to understand the data itself and the taxonomy, whether it was to understand what happened (in the past) or whether to create extensions or hypothesis (into the future) to create experiments (Lean Startup to build, measure & learn).

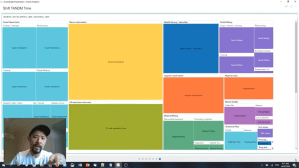
What started out as a random set of visualisations about the data turned into a structure story of discovery, deeper insight and eventual hypotheses of experiments. In addition to this loop of discovery, I also used our Data Science Cloud to explore further the statistical nature of the data.

I didn’t go as far as machine learning or predictive modelling but I did use the same environment to understand more about the data. It trended and analysed the data, created visualisations of the features where I can quickly assess what is there – across the many data elements. It helped me to draw relationships between different facts and measures.


The outcome of this was to “see data in new ways; discover insights; unlock end possibilities” – which is aligned to Oracle’s mission statement.

The analysis that I was able to explore and discover was specifically on “How do we help more consumers to gain this level of medical and emotional support?” And this is what I found.
There were patients being turned away from camp sites. And more in Brisbane and at a specific time.


There was a campsite that 8 patients were turned away. However, the numbers lied as there was no data for the 8 patients. So, I looked at the week after. And there was data there.


So, what happened to the shift where 8 patients were turned away? Was it a data collection issue? Did the shift run at all?
The effectiveness of the conversations needed more detail and hence, collaboration with Cogniom and TANDM would help capture the conversation and the quality of the conversation better.

There are plenty of opportunities to explore and experiment to learn and do better. There are specific use-cases in the data that helps us to determine what we can do.
You can find the full video here – https://youtu.be/xK8fWets7Gk.
All of these components are available in Oracle Cloud as part of Oracle Cloud Infrastructure. For the purposes of this event, I kept it as open as possible, using freely accessible tools to enable as many people to access the content. The code, configuration and visualisations are available on my public git repository https://github.com/jlowe000/sunnystreet.

Nice write up , Jason. “Understand the past, to create a hypothesis about the future, and run experiments to validate them.
LikeLiked by 1 person
Thanks Pavan. It’s much appreciated. The experiments are two-fold – yes to validate the hypothesis and secondly (but not the latter) execute and create an impact along the way (ie active user experience).
LikeLike
This is gold
LikeLike