
Over the past couple of weeks, there’s been another Viz for Social Good project that was running. For this project, the supporter was Kiron Open Higher Education (https://kiron.ngo/en/) – an organisation that is providing a learning platform for refugees and underserved communities in the Middle East.
The project was to put a spotlight on refugees and immigrants and was linked to the virtual refugee conference called Amplify Now (https://virtualrefugeeconference.com/). Submitted projects went into the running to be featured at the conference itself.
So what’s my take on this?
Well, I wanted to take a couple of different angles to this project.
- Last time that I submitted a project, it was based upon Apache Spark and using Oracle Analytics Desktop as the visualisation tool with postgres and docker for a database. This time I wanted to present it live and publicly accessible.
- Looking at the project, I wanted to continue my connection to others in my community. Working on a project like this was nice, but I wanted to create a bigger impact to help the people that I know.
As a recap, this is what I chose to use for the last project.
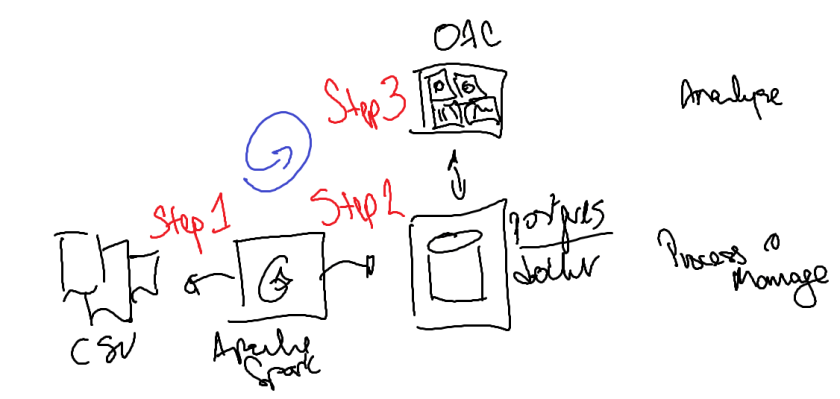
In this time, the datasets were primarily CSV or xls. It made sense in the initial phases of the project to keep using Oracle Analytics Desktop to learn more about the data that I was using. The simple visualisations and self-service approach to the data was … well … really simple.
This time round, I went with a different visualisation layer to host and present the data – and Oracle APEX (Application Express) was where I headed to for a couple of reasons.
- Oracle APEX is automatically configured in Autonomous Data Warehouse (ADW) in Oracle Cloud so the setup time is really quick (within minutes).
- ADW is available in the Oracle Cloud Always Free Tier which means that I can keep hosting it indefinitely (the datasets that I am presenting are tiny – well within the storage limit).
- And it’s been a while since I built anything Oracle APEX so it was a good time to stretch the fingers and did some #LowCode (yes ironic isn’t it).
In terms of technology and depth of what I did, it was pretty easy. (as I said above … really simple).
Even though there was data around, I need a thread of a story. It brought back memories about Chatloop (https://chatloop.org/) that helps refugees to learning English through social conversations (and chats) with learning partners. Here’s a glimpse of the Chatloop when they sponsored a problem at TADHack as part of this write-up (https://bit.ly/2zKGxPT)
The most difficult part of this was to determine where would I get data from that I could use. And I got the data from a few different sources.
- Australian Government Data Portal – https://data.gov.au/
- Queensland Government Open Data Portal – https://www.data.qld.gov.au/
- BBC Country Timeline web-site – http://news.bbc.co.uk/2/hi/country_profiles
- Australian Bureau of Statistics – https://www.abs.gov.au
Here is the result, here’s a video the output and walking through the data story.
There’s also a couple of things that I mixed up and did a little differently.
- I wanted to display the BBC News events in a timeline so I went searching for a timeline plugin. I found one here – https://apex.world/ords/f?p=100:700 in this Oracle APEX plug-in repository. It’s full of plug-ins that have been contributed by the community – some free, some commercially supported and some plugging into commercial software.
- I also tried a couple of things. I still used Oracle Analytics Desktop to look at the data and the charts showed me stuff that I wanted to use. So loading the data into APEX was a task that I needed to do. Because the dataset was relatively simple, I tried it out to Copy Data from the chart as a CSV into Oracle APEX and this next video shows the process.
So what’s next?
If you want to have a look at the data yourself, they there’s a couple of ways of doing.
- Head to my Oracle APEX site – https://bit.ly/3fEbRix or here if you want to know more about Oracle APEX itself – https://apex.oracle.com/en/
- Head to my git repo where you can import the APEX application and data or just look at the data itself and use your own tools – https://bit.ly/3hBE5MJ
You can also check out the last project that I did earlier in the year by heading over to the article “The Tech Behind The Social Good” – https://redthunder.blog/2020/03/17/the-tech-behind-the-social-good/.
If you want to participate in a Viz for Social Good, reach out to me at jason.lowe@oracle.com and I can connect you into the community.
If you want to get access to your own Oracle Cloud Always Free account, you can either head to the site – https://www.oracle.com/cloud/free/ or join a hands-on workshop where we’ll be using Oracle Cloud.
