This Lab, logically follows previous steps required to provision and curate a Kubernetes cluster. Please review them before proceeding. If you are in doubt, feel free to contact me directly via https://www.linkedin.com/in/citurria/
In this Lab, we will show how to deploy microservices-based Applications into Kubernetes cluster. Then we are going to use an Open Source framework called Weave Scope, to gather in real-time runtime insight into it. We will finish by learning a few tricks to easily manage your microservices.
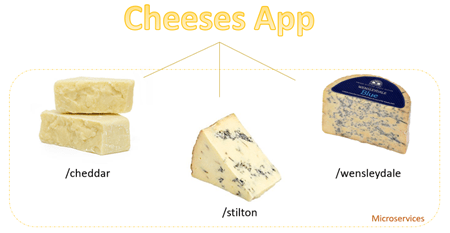
The Application that we are going to deploy is based on “Cheeses“. It is made of 3 microservices (3 types of cheeses) that when invoked via an API, they simply return their own name (i.e. cheddar, stilton, or wensleydale).
Given its simplicity, this will help us understand the key concepts related to Applications being packaged as Docker Images, running inside Pods, and seamlessly managed by Kubernetes controllers. All is left to do by us, is to define a “desired” state, and Kubernetes does the rest.
Deploying your Cheeses Microservices
First let’s have a look at the different types of Kubernetes resources that make up the Cheese Microservices.
- If you are an attendee of a live workshop, as your instructor access to your sandbox environment. Otherwise, if you provisioned your Kubernetes cluster on your own, SSH into your Kubernetes cluster where you deployed “kubectl”.
- If you need root privileges, escalate your bash running: sudo bash
-
Change directory to /tmp/mgt/env/envIngress
cd /tmp/mgt/env/envIngress
-
List the cheeses-related resources:
ls -l cheese*

-
There are 3 type of resources that make the Cheeses Application:
- Deployments
- Services
- Ingresses
- Deployments
- Let’s drill down into each of them.
Deployments
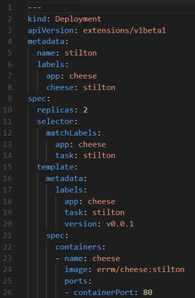
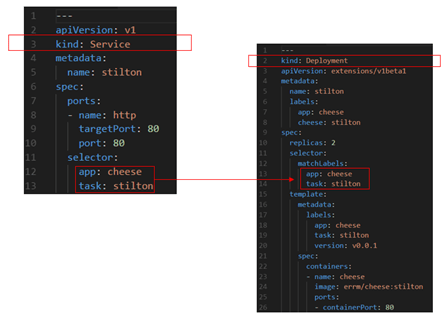
Kubernetes deployments involves 3 main components:
- Metadata: Name, Kind, Labels, Version, etc.
- Containers: The actual Application microservice(s) to be run in the form of one or multiple images (usually Docker Images). As well as the intended Port where the application inside the container will run.
-
Replicas: Desired number of instances that we want Kubernetes to run and ensure it keep running. If one instance of the deployment terminates for whatever reason and the desired state is no longer met, kubelet and replica-set controller work in conjunction to ensure new instances are created to maintain the “desired” state. In this case, 2 replicas are configured on each of the configured deployments.
- Open cheese-dpl.yaml and explore each of these parameters for each of the 3 defined deployments (e.g. stilton, cheddar, and wensleydale).
 |
 |
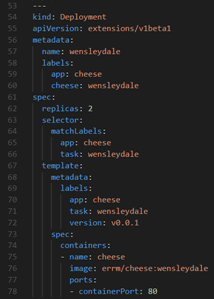 |
Notice that all 3 deployments run under the same Application name, i.e. cheese, but they run different task names (cheddar, stilton, and wensleydale) – This will make it easier to be referenced later.
Services
Services are used to provide a consistent point of reference to the actual Application microservice(s), regardless of what Pod is serving the request in the backend. Remember that Pods are dynamic, they will come and go often. Services provide the bridge to be able to reference them from a usability point of view.
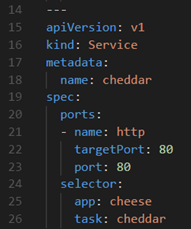
- Open cheese-svc.yaml and explore each of these parameters for each of the 3 defined services (e.g. stilton, cheddar and wensleydale).
Cheese services have the different components:
- Generics: apiVersion, kind, metadata name.
-
Port specs:
- Port: Port is the port number which makes a service visible to other services running within the same K8s cluster. This is so that a service can invoke another service running within the same Kubernetes cluster.
- Port Name: Canonical name of the port where our application will run. This is good practice, as later we can connect from other containers. That way we can just refer to this port name, instead of the actual port.
- Target Port: Target port is the port on the POD where the service is running.
-
Nodeport: Node port is the port on which the service can be accessed from external users using Kube-Proxy. We are not using this one, as we are defining an ingress (LB), as you will see briefly.
-
Select specs: This is where we link a service to an actual Deployment. We do this via matched against the actual app and task of each Cheese deployment.
That is:
Feel free to explore the other 3 cheese services:
 |
 |
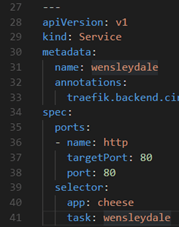
Note: Ignore the Wensleydale annotation for now, that is part of a later lab. |
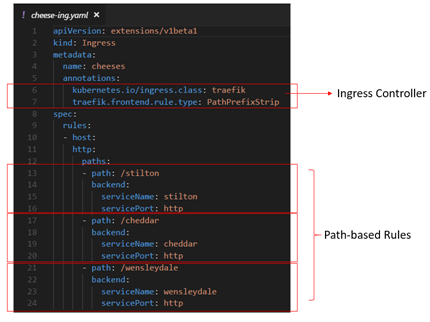
Ingresses
As mentioned before, there are a few ways we can ensure that our Applications running inside Pods can be externally accessible from the outside world. Using Services is one way to maintain a reference point to the dynamic world of Pods, but then somehow, we need to make sure that services are also referenced from outside the kubernetes cluster.
Nodeport, is a mechanism to easily expose a service outside the kubernetes cluster. It basically exposes a port to the outside world (via kube-proxy) and assigns it a Service. However, what happens if you want to balance load?
Ingresses on the other side, allow to create load balancing rules to give services external access/routing outside the kubernetes cluster to services within the kubernetes cluster. It can provide load balancing traffic, SSL termination, name-based routing, etc. Ingresses are purely definition/rules-configurations. They require an Ingress Controller (basically a Load Balancer) within the Kubernetes cluster. Traefik is the Ingress Controller that we are using as part of this HOL.
- Open cheese-ing.yaml and explore each of path-based rules for each of the 3 defined services (e.g. stilton, cheddar, and wensleydale).
Deploying Cheeses Microservices resources
-
First let’s make sure that your Cheeses microservices are not running.
- Go back to the Kubernetes Dashboard UI
- Filter by default namespace
- Go to Workloads > Deployments – Make sure you don’t see any deployment for a Cheese Microservice (i.e. cheddar, stilton, and wensleydale)

-
Go back to your PuTTY terminal window where you previously sudo bash and using kubectl create the deployments of the Cheeses microservices:
Note: Just to keep it consistent with the rest of the Deployments, let’s redirect all traffic to /tmp/noise.out
That is:
kubectl create -f /tmp/mgt/env/envIngress/cheese-dpl.yaml >>/tmp/noise.out
- Go back to the Kubernetes Dashboard UI > default > Deployments and make sure you are running the 3 Cheeses Microservices Deployments. Also notice that each deployment should be running at least 2 Pods, as specified in the “desired” state, defined in the YAML file.

Monitoring your Cheeses Microservices
Once your Cheeses Microservices are deployed and externally accessible, let’s use Weave Scope to gather real-time visibility of the different interactions at runtime.
- Go back to your Remote Windows Desktop, and open Google Chrome if not already open.
- Open a new tab and click on the “WeaveScope Dashboard” bookmark.

-
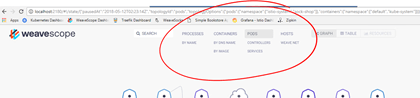
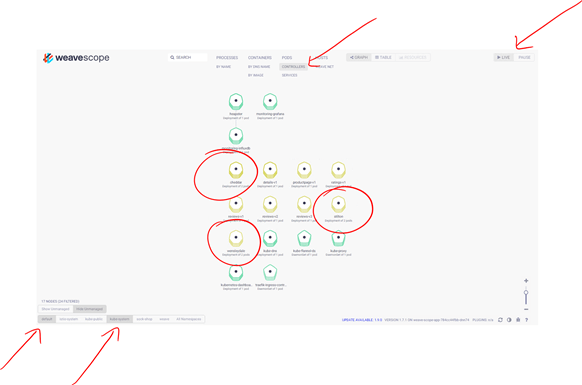
WeaveScope Dashboard will open. At the top it has 4 main categories to filter by:
- Processes
- Containers
- Pods
- Hosts
-
Also, it provides 2 main viewing options:
- Graph
- Table

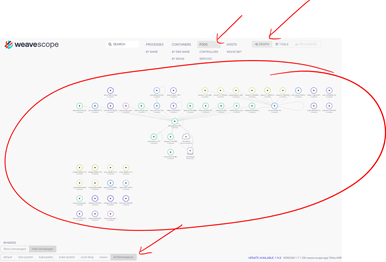
- Click each of the different categories using the Graph mode selected and notice how different topologies will appear in the dashboard with the various resources that are running in the kubernetes cluster.

- Also notice at the bottom that you can filter by namespaces. For example, select “All Namespaces” for Pods to display a global Pod view of the entire cluster.
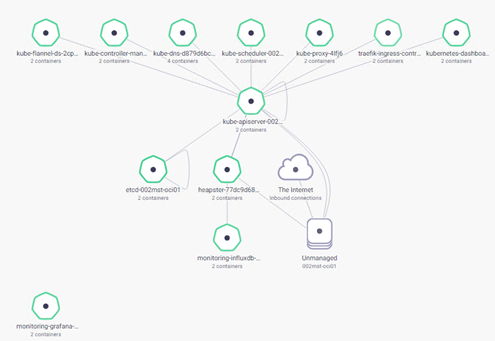
- Filter by kube-system namespace and notice all the components of the Kubernetes cluster (e.g. kube-controllers-managers, kube-dns, kube-scheduler, kube-proxy, kube-ingress-controller, kube-dashboard, etcd, etc.) and their interaction to the main kube-apiserver component:
- Now, filter Pods only by default namespace now and notice the 3 sets of 2 pods each for each for the different Cheese-Microservices

- Notice that you can combine multiple namespaces as part of a single filter. For example, keep both default and kube-system selected:

-
WeaveScope is going to correlate in real-time transactions as they occur. To test this, keep both default and kube-system namespaces selected and make a few calls to the 3 different cheeses-microservices APIs. For this, open 3 new browser tabs and respectively go multiple times (at least twice on each API) to:
http://localhost:[ClusterNo]280/cheddar
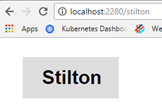
http://localhost:[ClusterNo]280/stilton
http://localhost:[ClusterNo]280/wensleydale
E.g.
 |
 |
 |
- Now go back to the WeaveScope Dashboard to review again the topology.
- Click on the Pause bottom at the top right, so that the associations stay while we review them carefully.

- Notice in the main graph a few associations coming from the Traefik Ingress-Controller into each of the Cheeses Pods.

- Click on the Traefik Ingress-Controller to gather more visibility on it
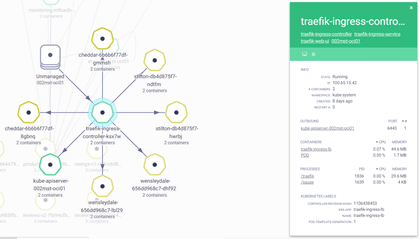
- Immediately you will gather information such as CPU, Memory, State, Processes, etc. Also, you will be able to attach to it and see the running log files by clicking on the Logs icon.

- Close the Logs and Traefik ingress-controller pop-up windows and now click on one of the Cheese Pods.
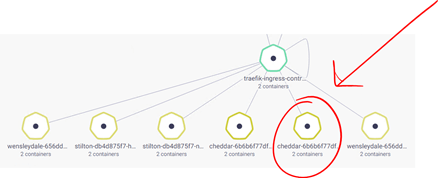
- Similarly, you will gather instant insight about this Pod. Notice that in the case of the Pod, it will also show the running containers.

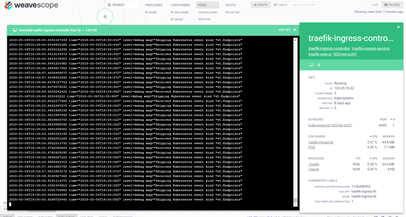
- Click on the Cheese Container

- You can see full visibility of the Container, including its processes, environment variables, docker labels, image type/size/name, etc.

-
In the top control menu, you can:
- Attach: See running log activity in the container
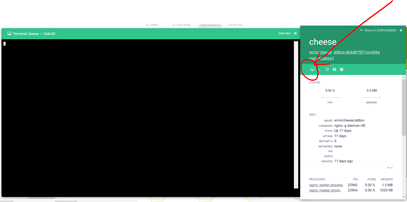
- Execute shell commands: Open a prompt window to enter commands
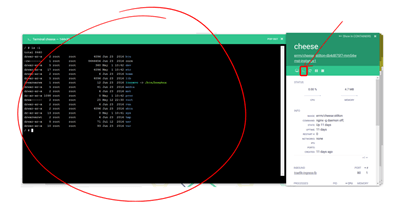
- Restart/Pause/Stop

Scaling your Cheeses Microservices
Now, let’s play with the native ability in Kubernetes to Scale our Applications horizontally.
- Still by having the default and kube-system namespaces selected and Live mode enabled, filter at the top by Controllers and locate your 3 Cheese deployments
-
Click on any of them.
Notice at the top bar of your Cheese deployment a “-“ and “+” icons. This will help us to scale in and out respectively, the number of Pods associated with the selected Cheese Application.
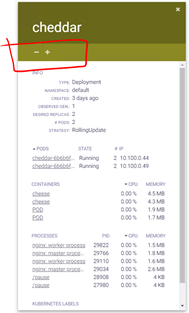
- Before scaling notice the current number of Pods running for this Application. It is 2 in this case:

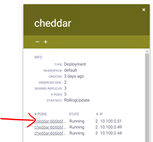
- Click on the “+” icon and notice how, within seconds, it increases the number to 3 Pods now.

-
Now, let’s simulate that something bad happens to any of the existing 3 Pods. Since the “desired state” is 3 Pods for this Application, when any of the 3 Pods terminates (for whatever reason), kubelet will notice and communicate that back to the replica-set controller, which will in turn delegate via the kube-scheduler to choose the best candidate to spin up a new Pod and then via the kubelet process running on that worker node, the new Pod will be created.
All of this runs almost instantaneously, if you are quick enough, you might be able to notice:
- Select any of the 3 Pods and click on it.
- Click on the bin at the top to delete it.

- The Pod pop up will automatically close.
- Back in the Cheese Application view, you will see that a Pod was terminated
- Within a second, a new Pod will be pending and finally instantiated. The “desired state” is preserved by Kubernetes!
Also, notice that the new Pods will come with new random internal IP Addresses. Although we could force them not to change, we really don’t care, as we are using Services to keep a bridge to the volatile and dynamic world of Pods.
- Feel free to play with these tools multiple times. Scale in and out, delete Pods and notice different behaviours.
- Finally, to complete these lab, open a new browser tab and click on the Traefik Dashboard bookmark.
- As you might remember, Traefik is the Ingress Controller used for the Cheeses microservices.
- It will basically show us all the different frontends (path-based routing rules) and backends (Pods) for each of the Cheese microservices.
- Also notice how when you scale out/in, the list of associated backend Pods automatically refreshes.

This is showing the value of using Traefik, because as mentioned, even though it is an external Load Balancer, it is Kubernetes friendly, which means that it keeps a constant feed into the Kubernetes API Server and it will auto-configure, based on changes happening inside the kubernetes cluster. In other words, you can easily scale out/in microservices and Traefik will auto-configure itself to map the latest view of the backend services.
I hope you found this blog useful. If you have any question or comment, feel free to contact me directly at https://www.linkedin.com/in/citurria/
Thanks for your time.

3 thoughts on “Cheeses App – Self-Healing and Scalability in Kubernetes…”