
OCI gives you flexibility to create custom metrics when no out of box metrics are available. There are two options on how this can be achieved. Depending on your use case let’s take a look at which choice works for you.
| Requirements | OCI Monitoring Service | OCI Stack Monitoring Service |
| View Metrics in Monitoring Service | Yes | Yes |
| Create Alarms | Yes | Yes – Automatically, emitted to Monitoring Service once Metric Extension is enabled for target resource |
| Metric Dimensions | Yes | Yes |
| Frequency Collection | Control by client API execution, cron job, scheduler or agent | Yes – can be configured when creating the metric extension. |
| Collection can be directly executed by OS command, Script(eg. Shell, Python), SQL, JMX or HTTP (REST API) | Custom Metrics can be published using OCI CLI or REST API | Yes – Use Metrics Extensions |
| Centrally manage Custom Metrics for single or multiple resources – Enable, Clone, Export/Import | Yes | |
| Define collection based on Resource Types (eg. apache_http_server, apache_tomcat, oci_oracle_db, ebs_instance, host_linux, host_windows, miscrosoft_iis, sql_server etc…) | Yes | |
| Baseline and Anomaly detection in Metrics using ML based algorithms | Yes | |
| Perform correlation across multiple metrics | Yes | |
| Apply Metric Extension lifecycle phases: Test and Validate, Publish | Yes | |
| Custom Metric Collection from OCI, on-premise and/3rd party Cloud | Yes | Yes |
| Alert against log data from OCI Logging Analytics | Yes – The Detection Rule needs to be created in OCI Logging Analytics | |
| Custom Metric collection using Prometheus Exporter | Yes | Yes |
Option 1: OCI Monitoring – Custom Metrics using Custom Metrics Namespace
This option gives the ability to define a new name for the custom metric namespace eg. custom_node_exporter.
A) WHEN USING O&M AGENT
1. Create Dynamic Group (eg. agent_dyngroup) in OCI
IDENTITY & SECURITY > DOMAINS > [Select Domain eg. Default] > DYNAMIC GROUPS > CREATE DYNAMIC GROUP
ALL {resource.type='managementagent', resource.compartment.id='<COMPARTMENT_OCID>'}NOTE: Replace <COMPARTMENT_OCID> with your target Compartment OCID for the Compartment where your Agent Host resides eg. ocid1.compartment.oc1..aaaaaaaaxxxxxxxxxxxxxxx
2. Create Policy Name (eg. custom_node_exporter_policy) in OCI
IDENTITY & SECURITY > POLICIES > CREATE POLICY
ALLOW DYNAMIC-GROUP agent_dyngroup TO USE METRICS IN COMPARTMENT <COMPARTMENT_NAME> where target.metrics.namespace = 'custom_node_exporter'NOTE: Replace <COMPARTMENT_NAME> with your target Compartment.
Replace the namespace “custom_node_exporter” with your own custom namespace.
Avoid using namespace with prefix “oracle_” or “oci_”.
3. An Example of uploading custom metrics via the O&M agent, please see:
- Prometheus Node Exporter Upload
https://blogs.oracle.com/observability/post/using-oci-management-agents-to-collect-performance-metrics-for-cloud-native-environments - Logging Analytics – Log Detection Rule
https://docs.oracle.com/en-us/iaas/logging-analytics/doc/create-schedule-run-saved-search.html
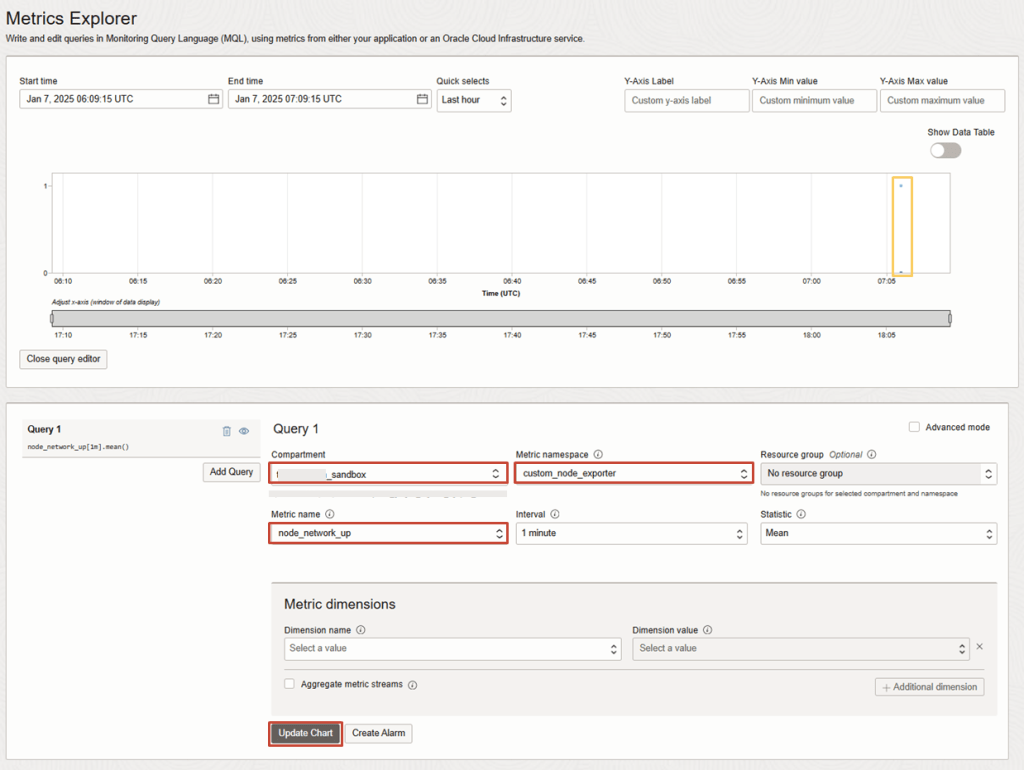
4. Once agent has uploaded the first metric collection, it will generate the new namespace. To verify:
- In OCI Console, navigate to:
OBSERVABILITY & MANAGEMENT > MONITORING: METRICS EXPLORER - Set Compartment, The New Metric namespace eg. custom_node_exporter, followed by the Metric Name, Interval and Statistic.
- Click on Update Chart
You should see the data points for the recent upload.
B) WHEN USING OCI CLI OR REST API
The metric namespace will be created during the initial data point is emitted for the custom metric. In this example we will use OCI CLI to demonstrate.
1. Create Policy Name (eg. custom_metric_namespace_policy) in OCI
IDENTITY & SECURITY > POLICIES > CREATE POLICY
ALLOW GROUP om_admins TO USE METRICS IN COMPARTMENT <COMPARTMENT_NAME> where target.metrics.namespace = 'custom_metrics'TIP: In this option grant the permission to the IAM Admin Group eg. om_admins. Users in this group will have ability to perform the metric upload without an agent.
Replace <COMPARTMENT_NAME> with your target Compartment.
Replace the namespace “custom_metrics” with your own custom namespace.
Avoid using namespace with prefix “oracle_” or “oci_”.
2. Verify the OCI version you are running the command:
oci -versionSample Output
3.51.1
3. Set variable in the current session to generate the JSON input file
region=ap-sydney-1
compname=xxx_sandbox
metric_namespace=custom_metrics
metric_name=confidential_computing

collection_timestamp1=$(date +\"%Y-%m-%dT%H:%M:%S+00:00\")
collection_timestamp2=$(date +\"%Y-%m-%dT%H:%M:%S+00:00\")

ctime=$(echo $(date)|sed 's/ /_/g')

compartment_id=$(oci iam compartment list --compartment-id-in-subtree true --all | jq --arg compname "$compname" '.data[] | select(."name"==$compname)' | jq -r ."id")

resource_id=dummy

resource_name=dummy

monitoring_endpoint=https://telemetry-ingestion.${region}.oraclecloud.com
TIP: Replace the above input values for the target environment
– region (target OCI region)
– compname (target compartment)
– metric_namespace (new metric namespace)
– metric_name (new custom metric name)
4. In same session, dynamically generate the JSON input file called custom_metrics.json, run as one command:
echo "[
    {
      \"compartmentId\": \"${compartment_id}\",
      \"datapoints\": [
        {
          \"count\": 10,
          \"timestamp\": ${collection_timestamp1},
          \"value\": 5.0
        },
        {
          \"count\": 3,
          \"timestamp\": ${collection_timestamp2},
          \"value\": 10.0
        }
      ],
      \"dimensions\": {
        \"resourceId\": \"${resource_id}\",
        \"ResourceName\": \"${resource_name}\"
      },
      \"metadata\": {
        \"category\": \"custom\",
        \"note\": \"This custom metric\"
      },
      \"name\": \"${metric_name}\",
      \"namespace\": \"${metric_namespace}\",
      \"resourceGroup\": null
    }
  ]" > custom_metrics.json
5. Verify the JSON File contents.
cat custom_metrics.jsonSample Output should look something like this:
[
    {
      "compartmentId": "ocid1.compartment.oc1..aaaaaaaaxxxxxxxxxxxxxxx",
      "datapoints": [
        {
          "count": 10,
          "timestamp": "2025-01-07T22:36:24+00:00",
          "value": 5.0
        },
        {
          "count": 3,
          "timestamp": "2025-01-07T22:36:24+00:00",
          "value": 10.0
        }
      ],
      "dimensions": {
        "resourceId": "dummy",
        "ResourceName": "dummy"
      },
      "metadata": {
        "category": "custom",
        "note": "This custom metric"
      },
      "name": "confidential_computing",
      "namespace": "custom_metrics",
      "resourceGroup": null
    }
  ]
6. To manually create the new metric namespace, execute the OCI command to initiate the metric upload. This will also emit the data points to the Monitoring service.
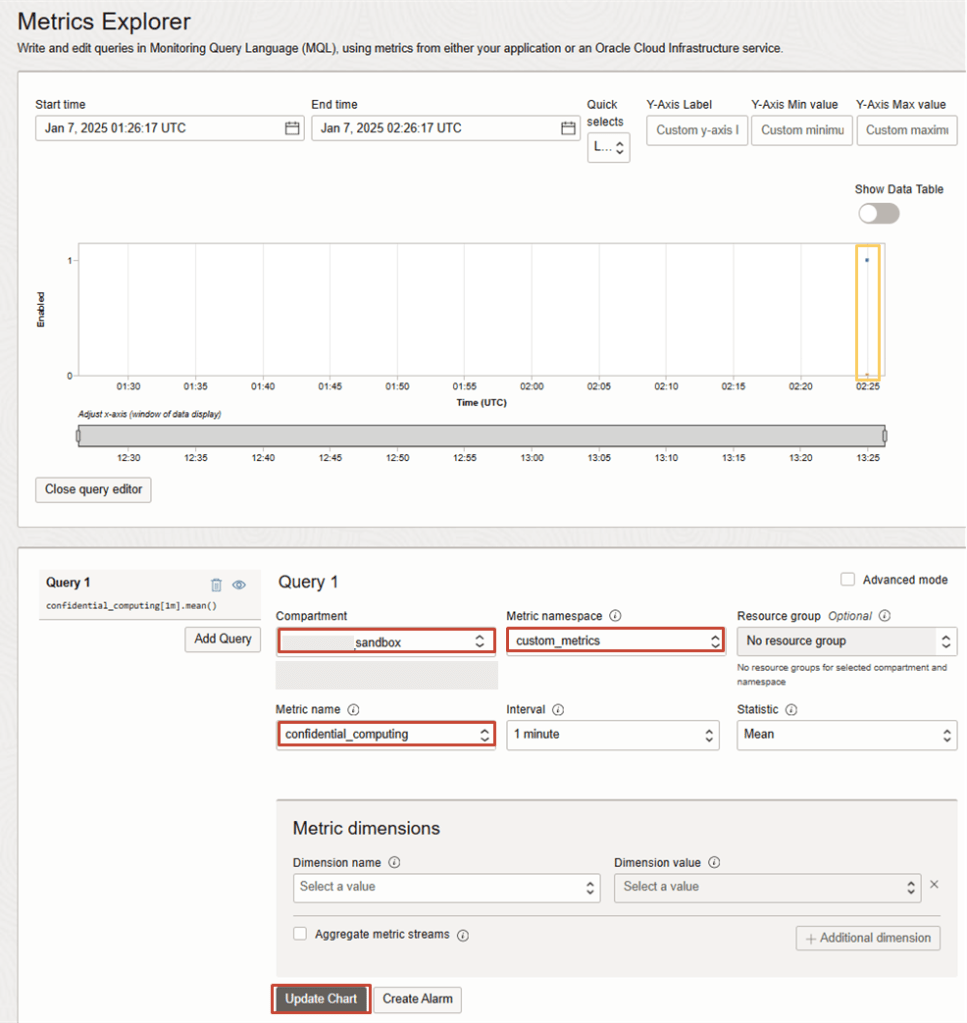
oci monitoring metric-data post --endpoint ${monitoring_endpoint} --metric-data file://custom_metrics.json7. Once agent has uploaded the first metric collection, it will generate the new namespace. To verify:
- In OCI Console navigate to:
OBSERVABILITY & MANAGEMENT > MONITORING: METRICS EXPLORER - Set Compartment, The New Metric namespace eg. custom_node_exporter, followed by the Metric Name, Interval and Statistic.
- Click on Update Chart
Option 2: OCI Stack Monitoring- Custom Metrics using Metrics Extensions
This option gives you ability use the existing predefined metric namespace called oracle_metric_extensions_appmgmt and resource group eg. host for emitting metrics.
In this section a Host based script will be used for demonstrating this use case.
PREREQUISITES
1. Create Dynamic Group (eg. agent_dyngroup) in OCI
IDENTITY & SECURITY > DOMAINS > [Select Domain eg. Default] > DYNAMIC GROUPS > CREATE DYNAMIC GROUP
ALL {resource.type='managementagent', resource.compartment.id='<COMPARTMENT_OCID>'}TIP: Replace <COMPARTMENT_OCID> with your target Compartment OCID for the Compartment where your Agent Host resides eg. ocid1.compartment.oc1..aaaaaaaaxxxxxxxxxxxxxxx
2. Create Policy Name (eg. custom_metric_namespace_policy) in OCI
IDENTITY & SECURITY > POLICIES > CREATE POLICY
ALLOW DYNAMIC-GROUP agent_dyngroup TO USE METRICS IN COMPARTMENT <COMPARTMENT> where any {target.metrics.namespace='oracle_metric_extensions_appmgmt', target.metrics.namespace='oracle_metric_extensions_appmgmt_test'}

ALLOW GROUP <ADMIN_GROUP> TO USE stack-monitoring-metric-extension IN COMPARTMENT <COMPARTMENT>

ALLOW GROUP <ADMIN_GROUP> TO {STACK_MONITORING_RESOURCE_UPDATE, DBMGMT_MANAGED_DB_UPDATE, DBMGMT_MANAGED_DB_CONTENT_WRITE, DBMGMT_EXTERNAL_DBSYSTEM_UPDATE, DBMGMT_EXTERNAL_DBSYSTEM_CONTENT_WRITE} IN COMPARTMENT <COMPARTMENT>
TIP: Replace <COMPARTMENT_NAME> with your target Compartment eg. xxx_sandbox.
Replace <ADMIN_GROUP> with your target IAM Group who needs to use the metric-extension features eg. om_admins
3. Verify you have an agent installed on all the target hosts to run the metric collection. If not installed, you can follow the steps documented in my earlier post.
4. Discover the target Resource in Stack Monitoring, by navigating to in OCI Console:
OBSERVABILITY & MANAGEMENT > STACK MONITORING > DISCOVER RESOURCES
5. Don’t forget to set your target Compartment where your Agent host resides.
And then click on Discover New Resources

6. In this case you would discover the Resource Type as Host to deploy Metrics Extension for OS command or Host based scripts.

If you did not set the target Resource to Enterprise Edition, then you can set it after discovery by navigating to:
OBSERVABILITY & MANAGEMENT > APPLICATION PERFORMANCE MONITORING: STACK MONITORING > SERVICE MANAGEMENT : LICENSING
STANDARD > [Select Target Resource ] > ENTERPRISE
CREATE HOST BASED SCRIPT
1. First let’s create a host based script called check_file.sh to generate the metric output to check if a file exists and if so return 1, otherwise it will return 0
sudo su - oracle-cloud-agent -s /bin/sh
mkdir /var/lib/oracle-cloud-agent/scripts
Create file: /var/lib/oracle-cloud-agent/scripts/check_file.sh with the subsequent code:
#!/bin/bash
CHECK_FILE=/tmp/test.out

if [ -f "${CHECK_FILE}" ] ; then
        RESULT=1
else
        RESULT=0
fi

printf "oci_result=${RESULT}|"
2. Set execute permission on file
chmod +x /var/lib/oracle-cloud-agent/scripts/check_file.sh3. Test the Script and verify output returns 0
/bin/bash /var/lib/oracle-cloud-agent/scripts/check_file.sh Sample Output
oci_result=0|
4. Create a test file and rerun script again
touch /tmp/test.out5. Re-run script to verify output file now returns 1
/bin/bash /var/lib/oracle-cloud-agent/scripts/check_file.sh Sample Output
oci_result=1|
CREATE METRIC EXTENSION
1. In OCI Console, navigate to:
OBSERVABILITY & MANAGEMENT > APPLICATION PERFORMANCE MONITORING: STACK MONITORING > MONITORING SETUP: METRIC EXTENSIONS
Set the target Compartment and then click on Create Metric Extensions

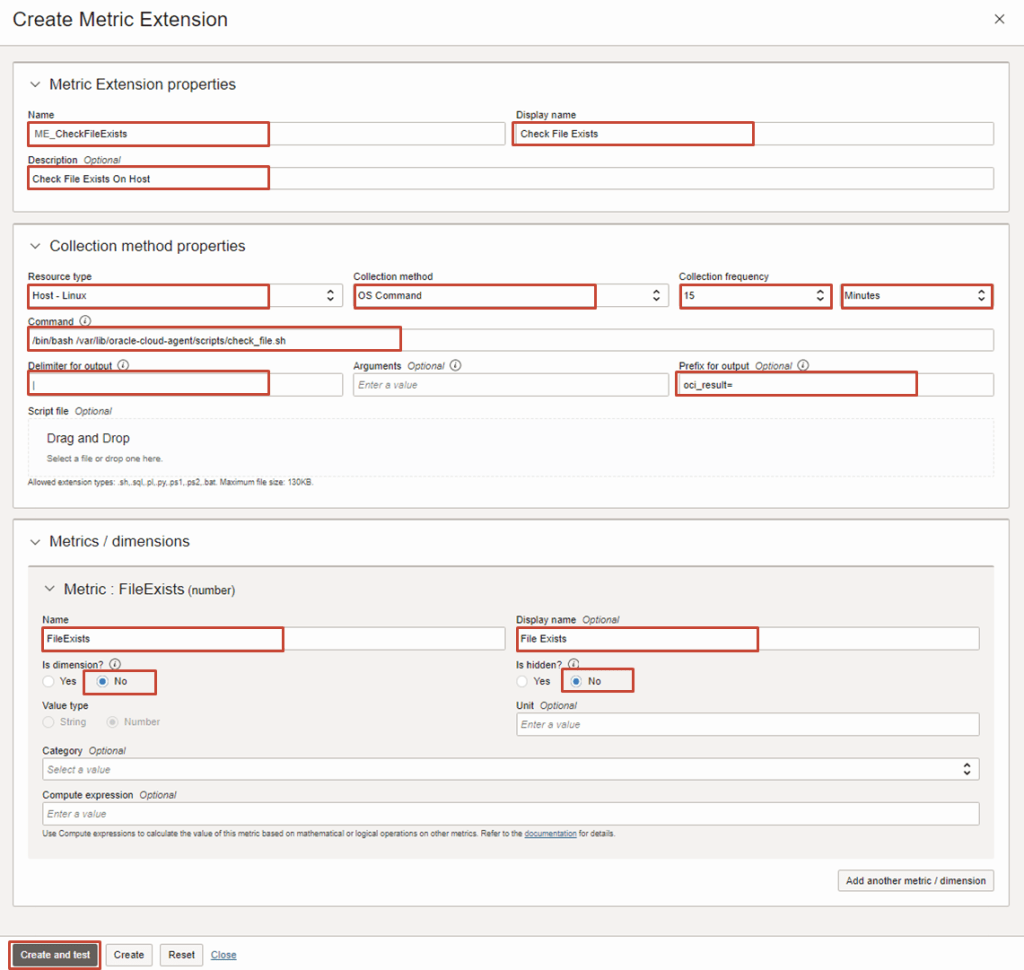
2. Enter the following inputs as required and click on Create and Test
- Name: eg. ME_CheckFileExists (The New Metric Extension Name)
- Display Name: Check File Exists (The Display Name of New Metric Extension Name)
- Description: Check File Exists on Host
- Resource Type: Host – Linux
- Collection Method: OS Command
- Collection Frequency: 15 minutes
- Command: /bin/bash /var/lib/oracle-cloud-agent/scripts/check_file.sh
- Delimiter: |
- Prefix for output: oci_result=
- Metric / Dimensions
- Name: FileExists
- Display Name: File Exists
- Is Dimension: No
- Is Hidden?: No
3. Choose Resource and Click on Test

4. Wait for a couple of minutes and will return Success.

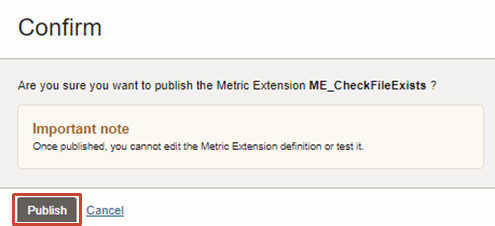
5. Click on Publish to confirm
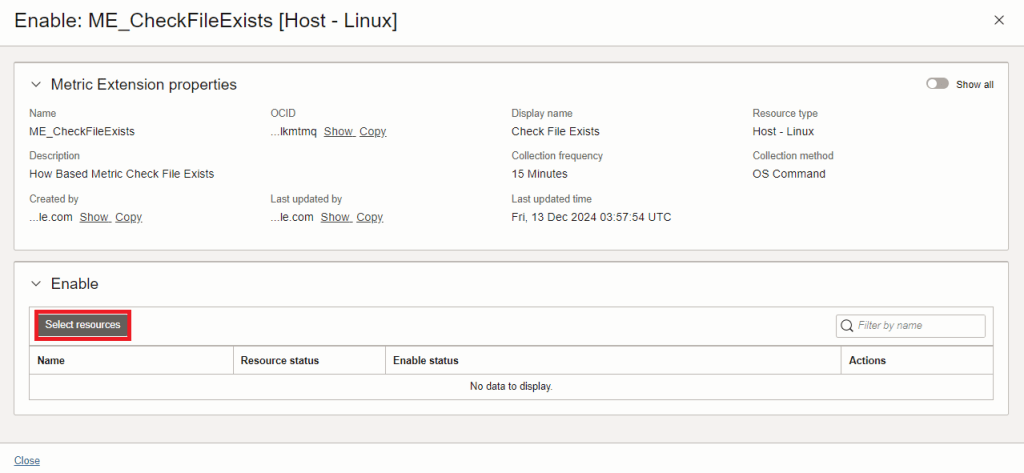
6. Now that the Metric Extension has been published, we can now enable it for target host(s)

7. Click on Select Resource
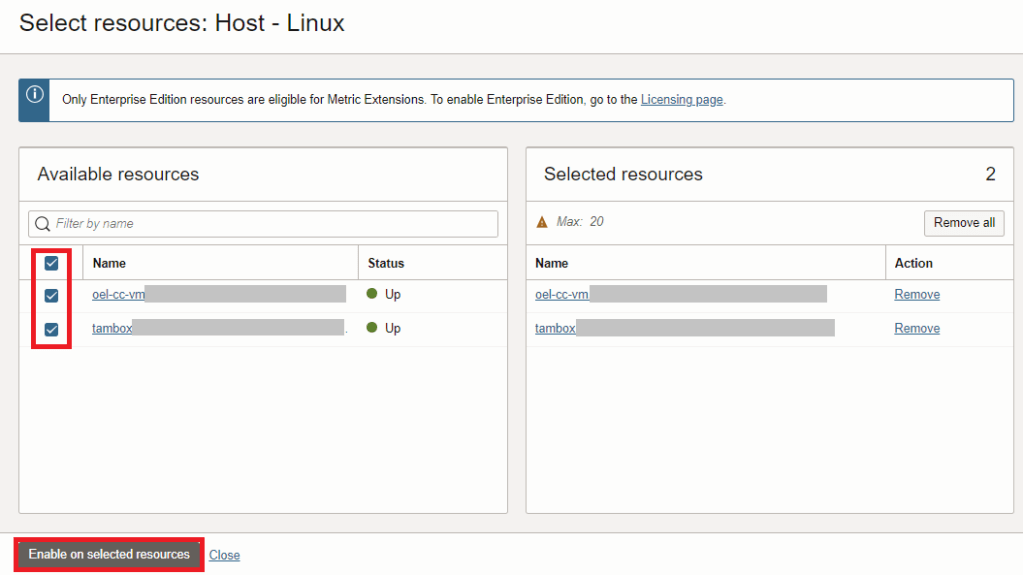
8. Choose the target resources you wish to run the script collection for and then click on Enable on selected resources
9. Click on Close
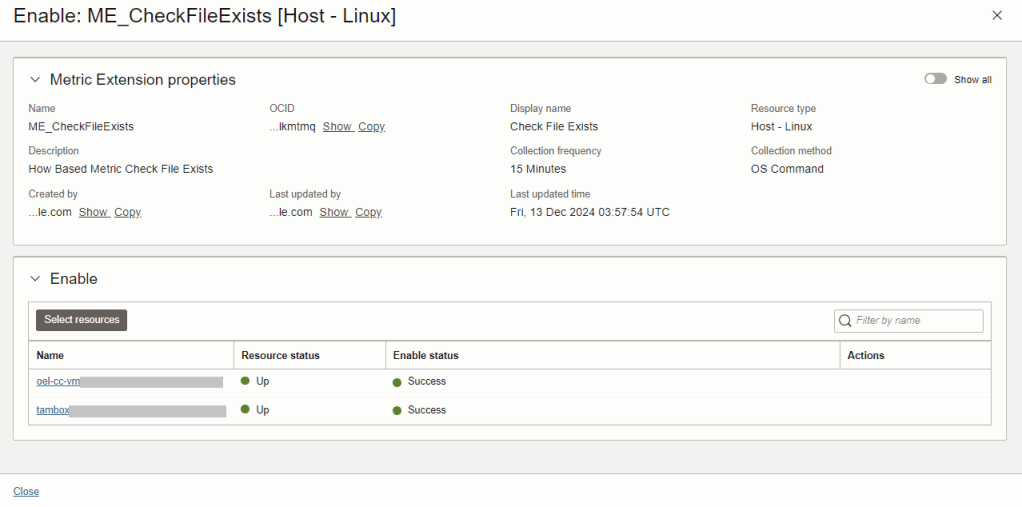
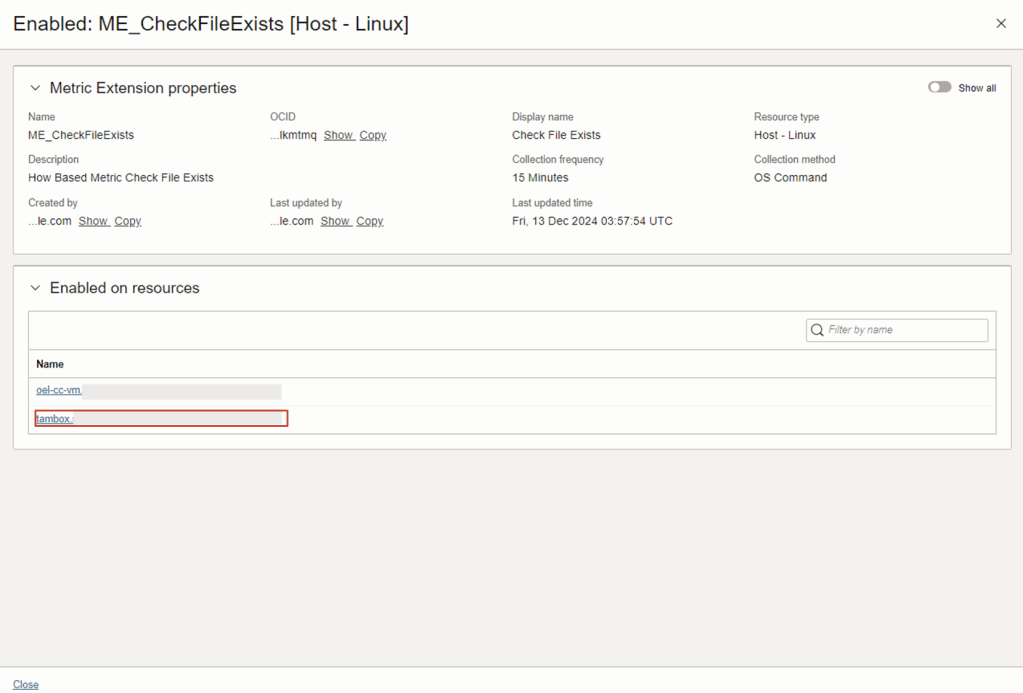
10. Drill into the Enable on resources
11. Drill into one of the Enabled resources.

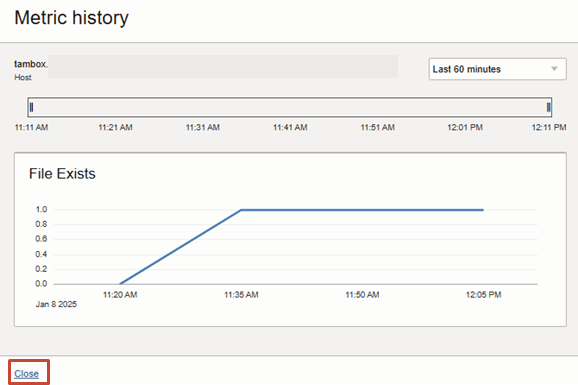
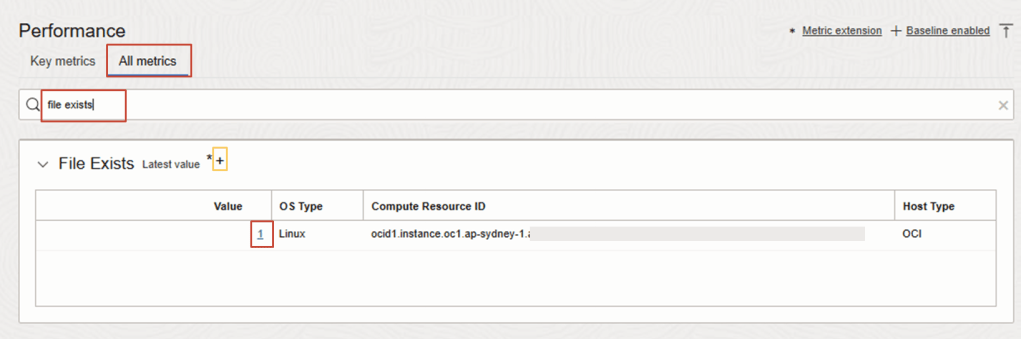
12. On the Stack Monitoring Resource Page, the Custom Metric Name File Exists is now being collected for the target resource.
From Target Resource Page eg. tambox, navigate to All metrics tab
Search keywords: File Exists
Drill into the column for Value, associate with Compute

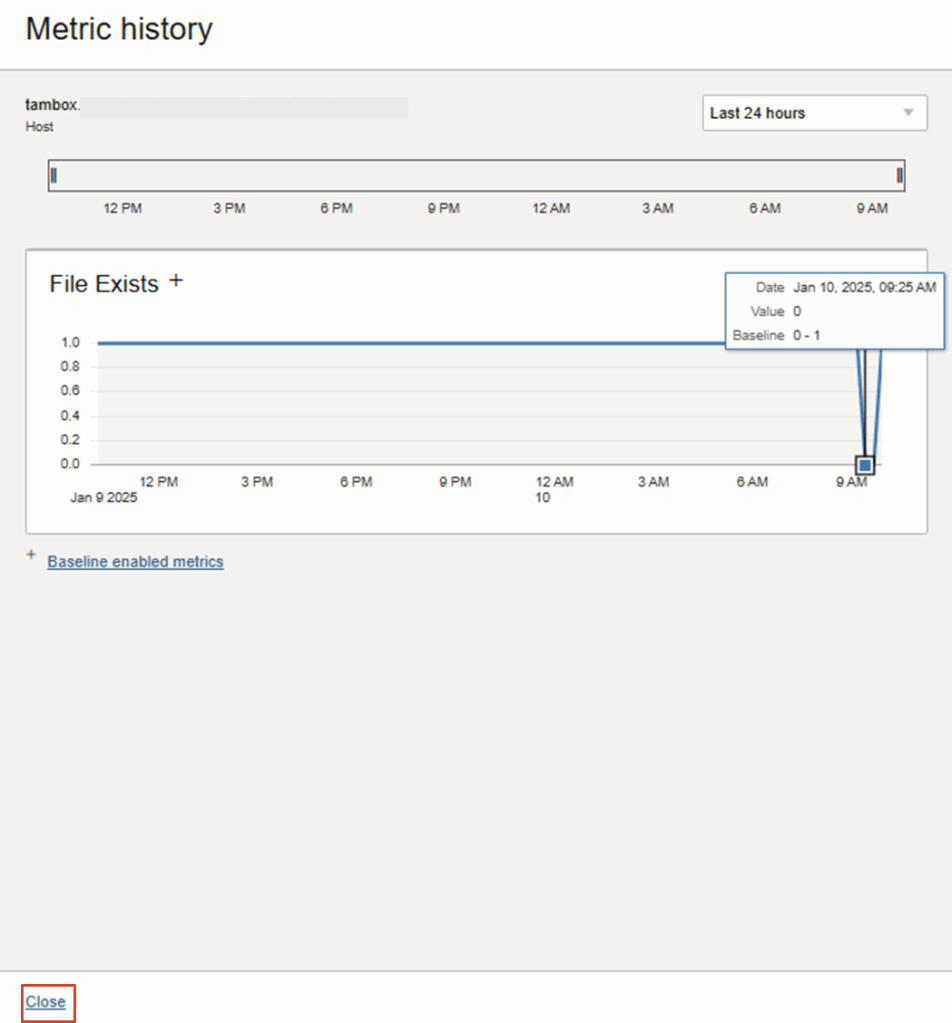
13. You should now see the metric history collection of data points that has been emitted for the target resource.
Click Close to exit the Metric History view.
ENABLE BASELINE FOR ANOMALY DETECTION
The Metric baseline and anomaly detection can be configured for the custom metric. This is an optional configuration.
1. In OCI Console, navigate to:
OBSERVABILITY & MANAGEMENT > APPLICATION PERFORMANCE MONITORING: STACK MONITORING > MONITORING SETUP: BASELINE AND ANOMALIES
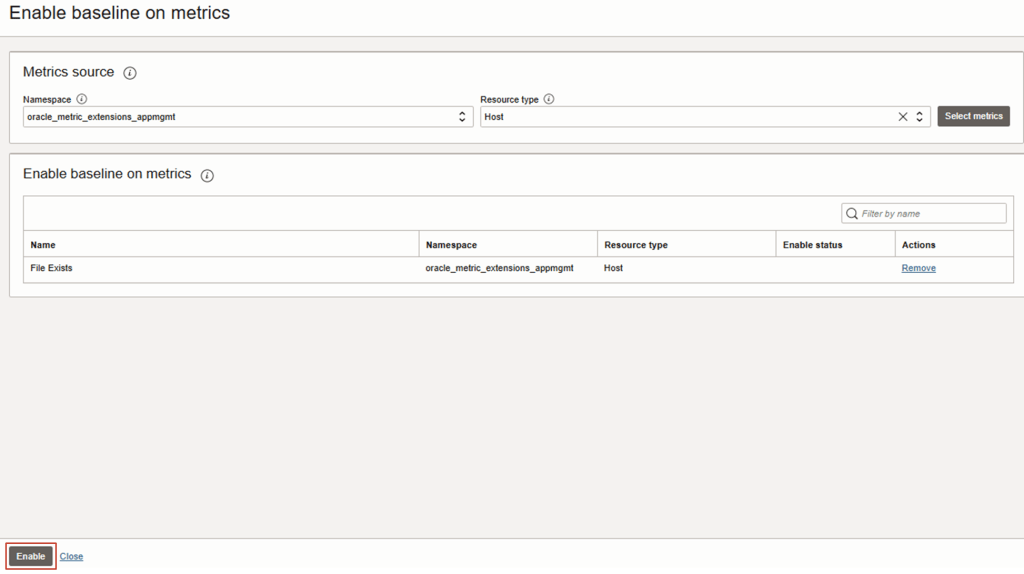
2. Set the target Compartment and then click on Enable baseline for metrics
3. Choose the following options below.
Namespace: oracle_metric_extensions_appmgmt
Resource Type: eg. Host
Click on Select Metrics

TIP: Please make sure you also specify the Resource Type eg. Host, that was associated with the Metric Extension created in the earlier step.
4. Choose the custom metric (eg. File Exists) that was configured earlier.

3. Click on Enable
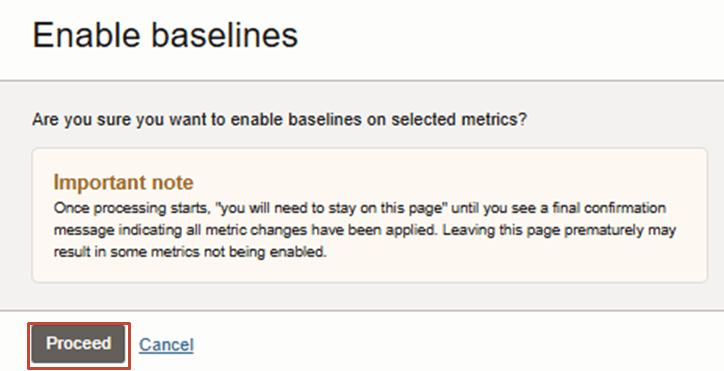
4. Click on Proceed
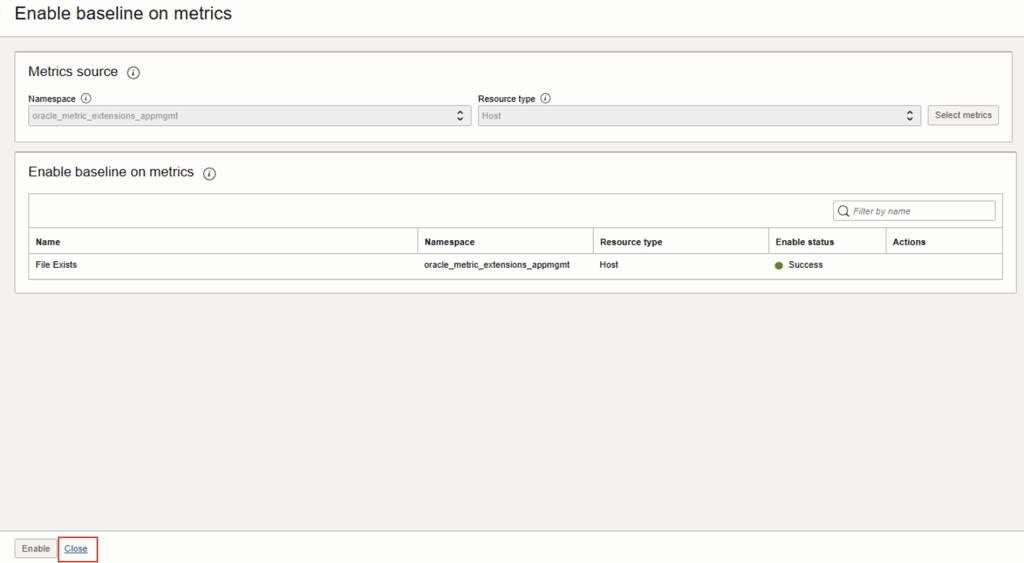
5. The Enable Status should now report as being Success. Then click Close
6. Now navigate to the Resource Page for the custom metric
OBSERVABILITY & MANAGEMENT > APPLICATION PERFORMANCE MONITORING: STACK MONITORING > MONITORING SETUP: METRIC EXTENSIONS
Drill into the Enable on resources
7. Drill into one of the Enabled resources.

8. On the Stack Monitoring Resource Page, the Custom Metric Name File Exists is now being collected for the target resource.
From Target Resource Page eg. tambox, navigate to All metrics tab
Search keywords: File Exists
Drill into the column for Value, associate with Compute
TIP: Now the “+” sign is marked next to the Custom Metric Name to indicate the Baseline feature has been enabled.
13. The baseline will take a few hours to create even though metric data points are emitted. Seasonality will apply within 5 days or until there is a clear pattern that emerges.
Click Close to exit the Metric History view.
USE MONITORING SERVICE TO EXPLORE OR CREATE ALARM
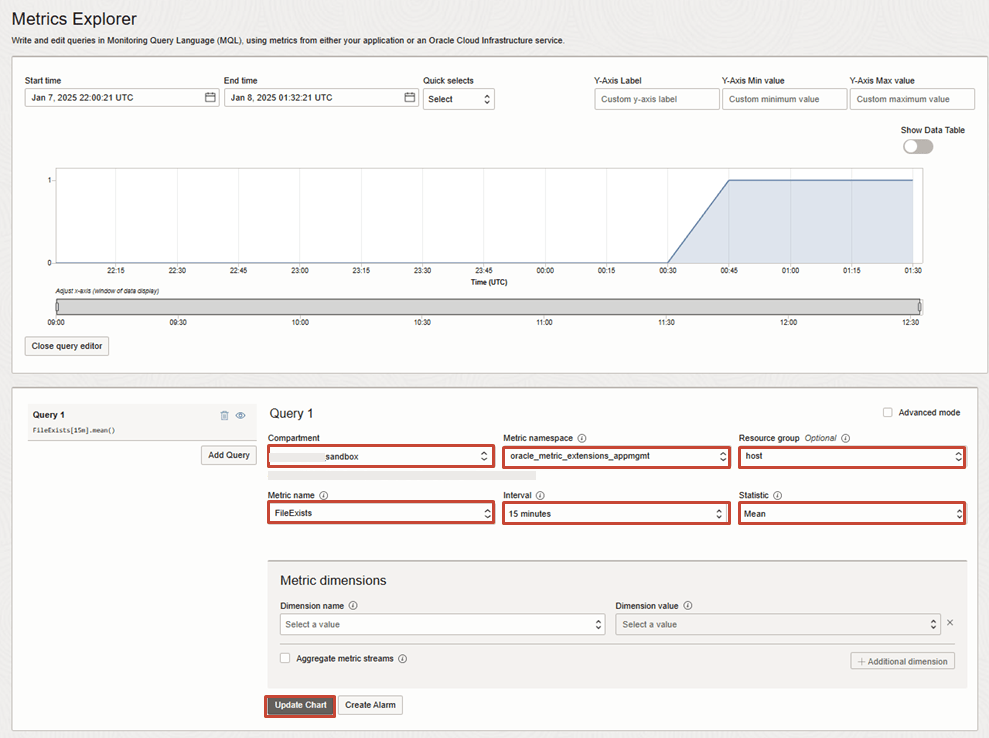
14. The custom metric can also be viewed in Monitoring Service
OBSERVABILITY & MANAGEMENT > MONITORING: METRICS EXPLORER
- Set the target Compartment
- Set Metric Namespace: oracle_metric_extensions_appmgmt
- Set Metric Name: eg. FileExists (this is your custom metric name)
- Interval eg. 15 min (make sure you choose a valid interval that you have data for)
- Statistics eg. mean
Then click on Update Chart.
15. To get notified when a condition or threshold is breached for your custom metric, you can create an alarm definition by clicking on Create Alarm.
For more details on creating alarm, see documentation

