
Oracle Enterprise Manager (EM) repository has a wealth of operational data (for host, database, middleware, apps and engineered systems) that it collects including configuration and metrics. By using Grafana, you can tap into that data to get Rich Analytics and Visualisations for Reporting.
Let’s have a look at how you can do this.
This assumes you already have an EM deployment running.
The following is a summary of steps to enable EM reporting using Grafana:
1. Review the EM App for Grafana Certification
2. Install Grafana OS Package
3. Deploy EM App for Grafana Plugin
4. Configure EM for Grafana Settings
5. Enable Network Rules for Grafana Console
6. Configure Grafana Data Source
7. Access Dashboards
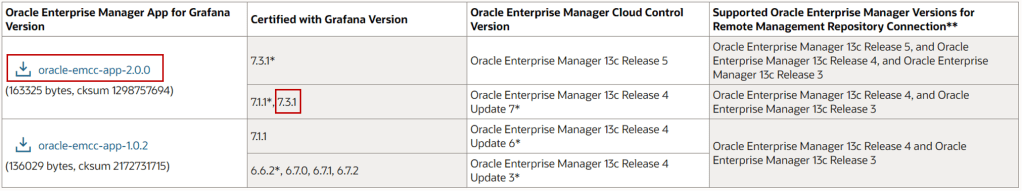
1 – REVIEW EM APP FOR GRAFANA CERTIFICATION
1.1 Go to the download page for EM App for Grafana.
Make sure you are on at least EM version 13.4 or later.
Download the certified version of EM App for Grafana plugin for your EM version.
https://www.oracle.com/enterprise-manager/downloads/grafana-downloads.html
NOTE: Please always check the Certification page for the latest.
In this example, my deployment is EM version 13.4 RU 8, so I will need to download:
- EM App for Grafana plugin – oracle-emcc-app-2.0.0
- Grafana Linux Package 7.3.1
2 – INSTALL GRAFANA OS PACKAGE
2.1 Login to host where you want to install Grafana and download the Grafana Linux Package
[opc@emcc ~]$ wget https://dl.grafana.com/oss/release/grafana-7.3.1-1.x86_64.rpm
-2021-05-27 05:19:21--  https://dl.grafana.com/oss/release/grafana-7.3.1-1.x86_64.rpm
Resolving dl.grafana.com (dl.grafana.com)... 151.101.54.217, 2a04:4e42:d::729
Connecting to dl.grafana.com (dl.grafana.com)|151.101.54.217|:443... connected.
HTTP request sent, awaiting response... 200 OK
Length: 53546325 (51M) [application/x-redhat-package-manager]
Saving to: ‘grafana-7.3.1-1.x86_64.rpm’

49% [=======================================>                                         ] 26,550,272  7.71MB/s  eta 5s     s100%[================================================================================>] 53,546,325  13.4MB/s   in 5.0s

2021-05-27 05:19:26 (10.1 MB/s) - ‘grafana-7.3.1-1.x86_64.rpm’ saved [53546325/53546325]
2.2 Install Grafana
[opc@emcc ~]$ sudo yum install grafana-7.3.1-1.x86_64.rpm
Loaded plugins: langpacks, ulninfo
Examining grafana-7.3.1-1.x86_64.rpm: grafana-7.3.1-1.x86_64
Marking grafana-7.3.1-1.x86_64.rpm to be installed
Resolving Dependencies
--> Running transaction check
---> Package grafana.x86_64 0:7.3.1-1 will be installed
--> Finished Dependency Resolution
ol7_UEKR5/x86_64                                                                                   | 2.5 kB  00:00:00
ol7_UEKR5/x86_64/updateinfo                                                                        |  80 kB  00:00:00
ol7_UEKR5/x86_64/primary_db                                                                        |  18 MB  00:00:00
ol7_addons/x86_64                                                                                  | 2.5 kB  00:00:00
ol7_developer/x86_64                                                                               | 2.5 kB  00:00:00
ol7_developer/x86_64/updateinfo                                                                    |  37 kB  00:00:00
ol7_developer/x86_64/primary_db                                                                    | 848 kB  00:00:00
ol7_developer_EPEL/x86_64                                                                          | 2.7 kB  00:00:00
ol7_developer_EPEL/x86_64/updateinfo                                                               | 163 kB  00:00:00
ol7_developer_EPEL/x86_64/primary_db                                                               |  15 MB  00:00:00
ol7_ksplice                                                                                        | 2.5 kB  00:00:00
ol7_latest/x86_64                                                                                  | 2.7 kB  00:00:00
ol7_latest/x86_64/updateinfo                                                                       | 3.2 MB  00:00:00
ol7_latest/x86_64/primary_db                                                                       |  35 MB  00:00:00
ol7_optional_latest/x86_64                                                                         | 2.5 kB  00:00:00
ol7_optional_latest/x86_64/updateinfo                                                              | 1.3 MB  00:00:00
ol7_optional_latest/x86_64/primary_db                                                              | 5.9 MB  00:00:00
ol7_software_collections/x86_64                                                                    | 2.5 kB  00:00:00

Dependencies Resolved

==========================================================================================================================
 Package                  Arch                    Version                  Repository                                Size
==========================================================================================================================
Installing:
 grafana                  x86_64                  7.3.1-1                  /grafana-7.3.1-1.x86_64                  169 M

Transaction Summary
==========================================================================================================================
Install  1 Package

Total size: 169 M
Installed size: 169 M
Is this ok [y/d/N]: y
Downloading packages:
Running transaction check
Running transaction test
Transaction test succeeded
Running transaction
  Installing : grafana-7.3.1-1.x86_64                                                                                 1/1
pam_tally2: Couldn't create /var/log/tallylog: Permission denied
pam_tally2: Authentication error
useradd: failed to reset the tallylog entry of user "grafana"
### NOT starting on installation, please execute the following statements to configure grafana to start automatically using systemd
 sudo /bin/systemctl daemon-reload
 sudo /bin/systemctl enable grafana-server.service
### You can start grafana-server by executing
 sudo /bin/systemctl start grafana-server.service
POSTTRANS: Running script
  Verifying  : grafana-7.3.1-1.x86_64                                                                                 1/1

Installed:
  grafana.x86_64 0:7.3.1-1

Complete!
2.3 Install Grafana
[opc@emcc ~]$ sudo systemctl status grafana-server
● grafana-server.service - Grafana instance
   Loaded: loaded (/usr/lib/systemd/system/grafana-server.service; disabled; vendor preset: disabled)
   Active: inactive (dead)
     Docs: http://docs.grafana.org
2.4 Enable Grafana, start service and check status
[opc@emcc ~]$ sudo systemctl enable grafana-server
[opc@emcc ~]$ sudo systemctl start grafana-server
[opc@emcc ~]$ sudo systemctl status grafana-server
● grafana-server.service - Grafana instance
   Loaded: loaded (/usr/lib/systemd/system/grafana-server.service; enabled; vendor preset: disabled)
   Active: active (running) since Thu 2021-05-27 05:22:58 GMT; 2s ago
     Docs: http://docs.grafana.org
 Main PID: 19250 (grafana-server)
    Tasks: 10
   Memory: 22.0M
   CGroup: /system.slice/grafana-server.service
           └─19250 /usr/sbin/grafana-server --config=/etc/grafana/grafana.ini --pidfile=/var/run/grafana/grafana-server...

May 27 05:22:58 emcc.xxx.com grafana-server[19250]: t=2021-05-27T05:22:58+0000 lvl=info msg="Executing migr...ble"
May 27 05:22:58 emcc.xxx.com grafana-server[19250]: t=2021-05-27T05:22:58+0000 lvl=info msg="Executing migr...key"
May 27 05:22:58 emcc.xxx.com grafana-server[19250]: t=2021-05-27T05:22:58+0000 lvl=info msg="Executing migr... v1"
May 27 05:22:58 emcc.xxx.com grafana-server[19250]: t=2021-05-27T05:22:58+0000 lvl=info msg="Executing migr...uid"
May 27 05:22:58 emcc.xxx.com grafana-server[19250]: t=2021-05-27T05:22:58+0000 lvl=info msg="Created defaul...dmin
May 27 05:22:58 emcc.xxx.com grafana-server[19250]: t=2021-05-27T05:22:58+0000 lvl=info msg="Starting plugi...gins
May 27 05:22:58 emcc.xxx.com grafana-server[19250]: t=2021-05-27T05:22:58+0000 lvl=info msg="Registering pl...nput
May 27 05:22:58 emcc.xxx.com grafana-server[19250]: t=2021-05-27T05:22:58+0000 lvl=info msg="External plugi...gins
May 27 05:22:58 emcc.xxx.com systemd[1]: Started Grafana instance.
May 27 05:22:58 emcc.xxx.com grafana-server[19250]: t=2021-05-27T05:22:58+0000 lvl=info msg="HTTP Server Li...ket=
Hint: Some lines were ellipsized, use -l to show in full.
3 – DEPLOY EM APP FOR GRAFANA PLUGIN
3.1 Install EM App for Grafana Plugin on Grafana host
NOTE: Plugin oracle-emcc-app-<version>.zip can be downloaded from https://www.oracle.com/enterprise-manager/downloads/grafana-downloads.html
[opc@emcc grafana]$ sudo grafana-cli –pluginUrl /tmp/oracle-emcc-app-2.0.0.zip plugins install oracle-emcc-app
NOTE: Make sure you use: "--pluginUrl" option to specify the full path to zip file for the EM app plugin.
Sorry for some reason the above font changes "--" to "-"
installing oracle-emcc-app @
from: /tmp/oracle-emcc-app-2.0.0.zip
into: /var/lib/grafana/plugins

✔ Installed oracle-emcc-app successfully

Restart grafana after installing plugins . <service grafana-server restart>
3.2 Restart Grafana service
[opc@emcc tmp]$ sudo systemctl restart grafana-server
[opc@emcc tmp]$ sudo systemctl status grafana-server
grafana-server.service - Grafana instance
   Loaded: loaded (/usr/lib/systemd/system/grafana-server.service; enabled; vendor preset: disabled)
   Active: active (running) since Thu 2021-05-27 05:31:19 GMT; 8s ago
     Docs: http://docs.grafana.org
 Main PID: 23053 (grafana-server)
    Tasks: 9
   Memory: 20.1M
   CGroup: /system.slice/grafana-server.service
           └─23053 /usr/sbin/grafana-server --config=/etc/grafana/grafana.ini --pidfile=/var/run/grafana/grafana-server...

May 27 05:31:18 emcc.xxx.com grafana-server[23053]: t=2021-05-27T05:31:18+0000 lvl=info msg="App mode produ...ings
May 27 05:31:18 emcc.xxx.com grafana-server[23053]: t=2021-05-27T05:31:18+0000 lvl=info msg="Writing PID fi...3053
May 27 05:31:18 emcc.xxx.com grafana-server[23053]: t=2021-05-27T05:31:18+0000 lvl=info msg="Connecting to ...ite3
May 27 05:31:18 emcc.xxx.com grafana-server[23053]: t=2021-05-27T05:31:18+0000 lvl=info msg="Starting DB mi...ator
May 27 05:31:18 emcc.xxx.com grafana-server[23053]: t=2021-05-27T05:31:18+0000 lvl=info msg="Starting plugi...gins
May 27 05:31:19 emcc.xxx.com grafana-server[23053]: t=2021-05-27T05:31:19+0000 lvl=info msg="Registering pl...nput
May 27 05:31:19 emcc.xxx.com grafana-server[23053]: t=2021-05-27T05:31:19+0000 lvl=info msg="Registering pl...urce
May 27 05:31:19 emcc.xxx.com grafana-server[23053]: t=2021-05-27T05:31:19+0000 lvl=info msg="Registering pl...-app
May 27 05:31:19 emcc.xxx.com systemd[1]: Started Grafana instance.
May 27 05:31:19 emcc.xxx.com grafana-server[23053]: t=2021-05-27T05:31:19+0000 lvl=info msg="HTTP Server Li...ket=
Hint: Some lines were ellipsized, use -l to show in full.
4 – CONFIGURE EM FOR GRAFANA SETTINGS
4.1 Login to EM host and switch to OS user oracle and set the SYSMAN Password environment variable.
NOTE: Set EM_PASS with your user SYSMAN user password
[opc@emcc tmp]$ sudo su – oracle
emrep:oracle@emcc:~> EM_PASS=<Set_SYSMAN_Password_Here>
4.2 Set the OMS properties to enable support REST API with Grafana
emrep:oracle@emcc:~> emctl set property -name oracle.sysman.db.restfulapi.grafana.enable -value true -sysman_pwd ${EM_PASS}
Oracle Enterprise Manager Cloud Control 13c Release 4
Copyright (c) 1996, 2020 Oracle Corporation.  All rights reserved.
Property oracle.sysman.db.restfulapi.grafana.enable has been set to value true for all Management Servers
OMS restart is not required to reflect the new property value
4.3 Set the OMS properties to enable execution of queries against EM repository via Grafana
emrep:oracle@emcc:~> emctl set property -name oracle.sysman.db.restfulapi.grafana.executesql.repository.query.enable -value true -sysman_pwd ${EM_PASS}
Oracle Enterprise Manager Cloud Control 13c Release 4
Copyright (c) 1996, 2020 Oracle Corporation.  All rights reserved.
Property oracle.sysman.db.restfulapi.grafana.executesql.repository.query.enable has been set to value true for all Management Servers
OMS restart is not required to reflect the new property value
4.4 Set the OMS properties to enable execution of queries against EM targets via Grafana
emrep:oracle@emcc:~> emctl set property -name oracle.sysman.db.restfulapi.grafana.executesql.target.query.enable -value true -sysman_pwd ${EM_PASS}
Oracle Enterprise Manager Cloud Control 13c Release 4
Copyright (c) 1996, 2020 Oracle Corporation.  All rights reserved.
Property oracle.sysman.db.restfulapi.grafana.executesql.target.query.enable has been set to value true for all Management Servers
OMS restart is not required to reflect the new property value
4.5 Optimise Performance of Concurrent Request
NOTE: This value can be adjusted to suit your environment
emrep:oracle@emcc:~> emctl set property -name oracle.sysman.db.restfulapi.grafana.throttle.max.concurrent.request -value 10 -sysman_pwd ${EM_PASS}
Oracle Enterprise Manager Cloud Control 13c Release 4
Copyright (c) 1996, 2020 Oracle Corporation.  All rights reserved.
Property oracle.sysman.db.restfulapi.grafana.throttle.max.concurrent.request has been set to value 10 for all Management Servers
OMS restart is not required to reflect the new property value
4.6 Optimise Performance of Max Request per User
NOTE: This value can be adjusted to suit your environment
emrep:oracle@emcc:~> emctl set property -name oracle.sysman.db.restfulapi.grafana.throttle.max.req.per.user -value 100 -sysman_pwd ${EM_PASS}
Oracle Enterprise Manager Cloud Control 13c Release 4
Copyright (c) 1996, 2020 Oracle Corporation.  All rights reserved.
Property oracle.sysman.db.restfulapi.grafana.throttle.max.req.per.user has been set to value 100 for all Management Servers
OMS restart is not required to reflect the new property value
4.7 Optimise Performance of Max Request per User Interval
NOTE: This value can be adjusted to suit your environment
emrep:oracle@emcc:~> emctl set property -name oracle.sysman.db.restfulapi.grafana.throttle.max.req.per.user.interval.sec -value 60 -sysman_pwd ${EM_PASS}
Oracle Enterprise Manager Cloud Control 13c Release 4
Copyright (c) 1996, 2020 Oracle Corporation.  All rights reserved.
Property oracle.sysman.db.restfulapi.grafana.throttle.max.req.per.user.interval.sec has been set to value 60 for all Management Servers
OMS restart is not required to reflect the new property value
5 – ENABLE NETWORK RULES FOR GRAFANA
If Grafana host sits behind a firewall or is located on a private network you will need to ensure that the following policy is enabled.
| Source | Destination | Port / Protocol | Comments |
| <Allowed_Source> | Grafana Host | 3000/tcp | Ingress Rule |
This example:
A Linux Firewall has been installed on Grafana host. Enable the rule to permit port 3000.
5.1 On Grafana host, add rule
[opc@emcc tmp]$ sudo firewall-cmd –permanent –add-port=3000/tcp
success
5.2 Restart Linux Firewall
[opc@emcc tmp]$ sudo systemctl restart firewalld
[opc@emcc tmp]$ sudo systemctl status firewalld
● firewalld.service - firewalld - dynamic firewall daemon
   Loaded: loaded (/usr/lib/systemd/system/firewalld.service; enabled; vendor preset: enabled)
   Active: active (running) since Thu 2021-05-27 06:00:02 GMT; 4s ago
     Docs: man:firewalld(1)
 Main PID: 4829 (firewalld)
    Tasks: 2
   Memory: 27.3M
   CGroup: /system.slice/firewalld.service
           └─4829 /usr/bin/python2 -Es /usr/sbin/firewalld --nofork --nopid

May 27 06:00:04 emcc.xxx.com firewalld[4829]: WARNING: COMMAND_FAILED: '/usr/sbin/iptables -w10 -w --table filter --delete FORWARD --destination 1... chain?).
May 27 06:00:04 emcc.xxx.com firewalld[4829]: WARNING: COMMAND_FAILED: '/usr/sbin/iptables -w10 -w --table filter --delete FORWARD --source 192.16... chain?).
May 27 06:00:04 emcc.xxx.com firewalld[4829]: WARNING: COMMAND_FAILED: '/usr/sbin/iptables -w10 -w --table filter --delete FORWARD --in-interface ... chain?).
May 27 06:00:04 emcc.xxx.com firewalld[4829]: WARNING: COMMAND_FAILED: '/usr/sbin/iptables -w10 -w --table filter --delete FORWARD --out-interface...hat name.
May 27 06:00:04 emcc.xxx.com firewalld[4829]: WARNING: COMMAND_FAILED: '/usr/sbin/iptables -w10 -w --table filter --delete FORWARD --in-interface ...hat name.
May 27 06:00:04 emcc.xxx.com firewalld[4829]: WARNING: COMMAND_FAILED: '/usr/sbin/iptables -w10 -w --table filter --delete INPUT --in-interface vi... chain?).
May 27 06:00:04 emcc.xxx.com firewalld[4829]: WARNING: COMMAND_FAILED: '/usr/sbin/iptables -w10 -w --table filter --delete INPUT --in-interface vi... chain?).
May 27 06:00:04 emcc.xxx.com firewalld[4829]: WARNING: COMMAND_FAILED: '/usr/sbin/iptables -w10 -w --table filter --delete OUTPUT --out-interface ... chain?).
May 27 06:00:04 emcc.xxx.com firewalld[4829]: WARNING: COMMAND_FAILED: '/usr/sbin/iptables -w10 -w --table filter --delete INPUT --in-interface vi... chain?).
May 27 06:00:04 emcc.xxx.com firewalld[4829]: WARNING: COMMAND_FAILED: '/usr/sbin/iptables -w10 -w --table filter --delete INPUT --in-interface vi... chain?).
Hint: Some lines were ellipsized, use -l to show in full.
5.3 Verify new rule permits port 3000 access
[opc@emcc tmp]$ sudo firewall-cmd –list-all
public
  target: default
  icmp-block-inversion: no
  interfaces:
  sources:
  services: dhcpv6-client ssh
  ports: 7803/tcp 4903/tcp 7301/tcp 9851/tcp 3000/tcp
  protocols:
  masquerade: no
  forward-ports:
  source-ports:
  icmp-blocks:
  rich rules:
5.4 Now confirm that you can login to Grafana console
NOTE: Enter user and password as admin/admin

5.5 Change Password for admin as prompted

6 – CONFIGURE GRAFANA DATA SOURCE
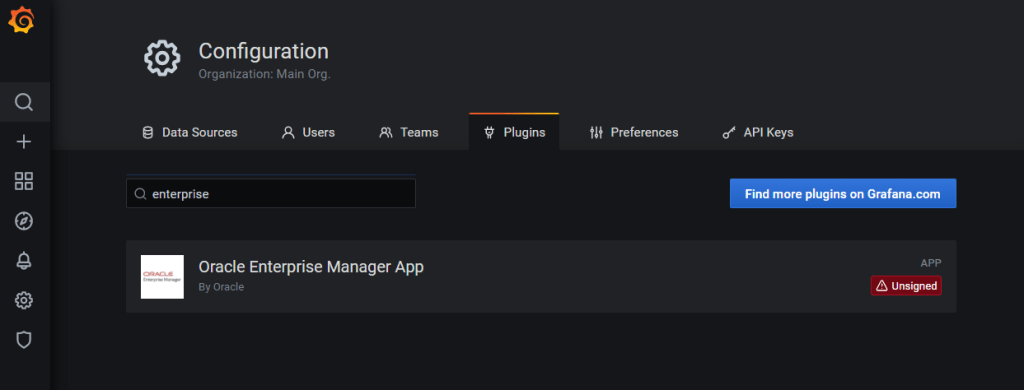
6.1 In Grafana Console, from menu, navigate to Configuration > Plugins

6.2 Search and Select Oracle Enterprise Manager App plugin
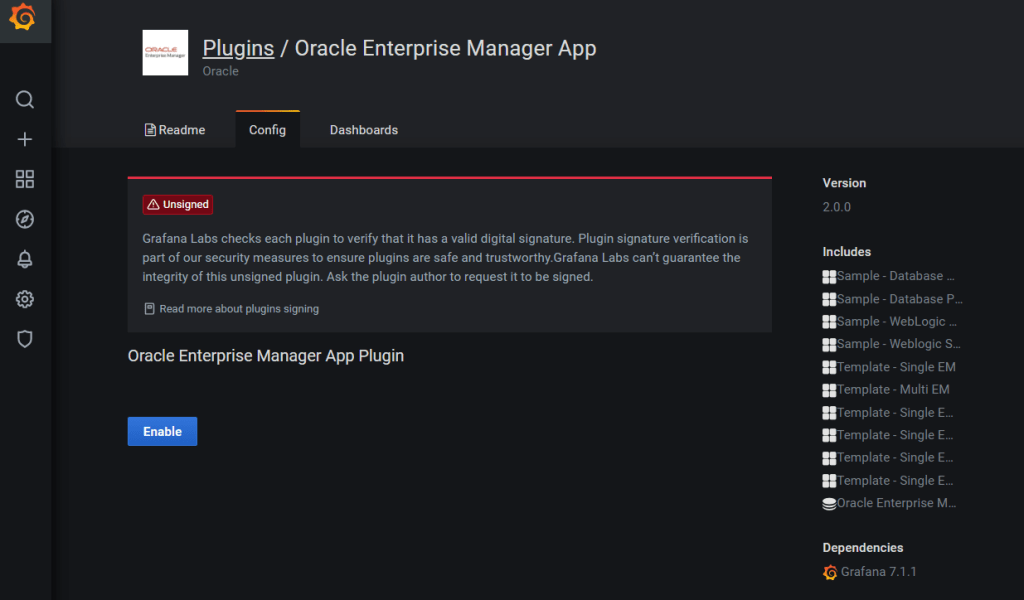
6.3 Click on Enable for Oracle Enterprise Manager App plugin
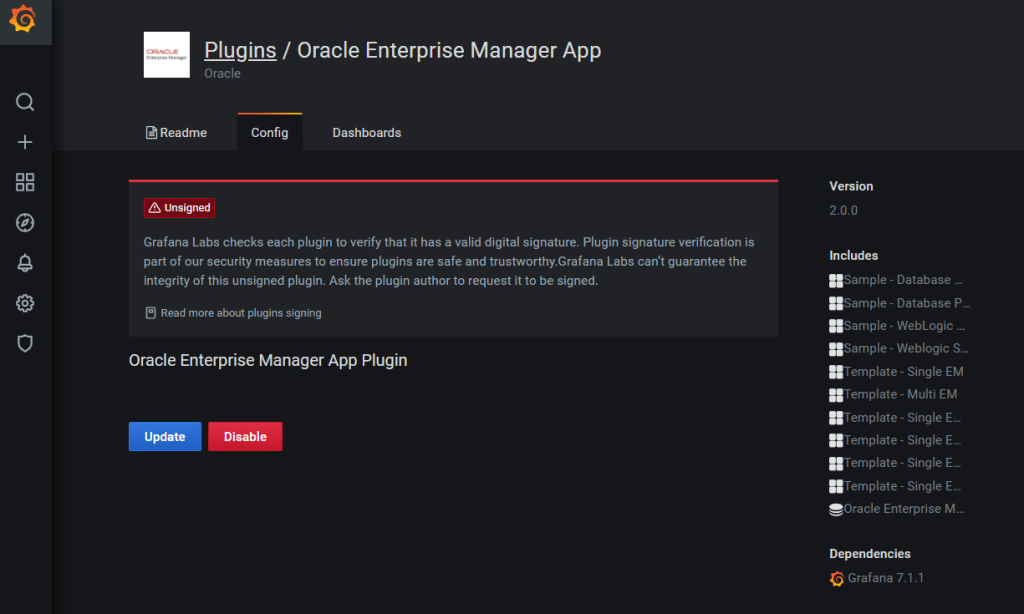
6.4 Then click on Update for Oracle Enterprise Manager App plugin
6.5 From menu, navigate to Data Sources and then click on Add Data Source
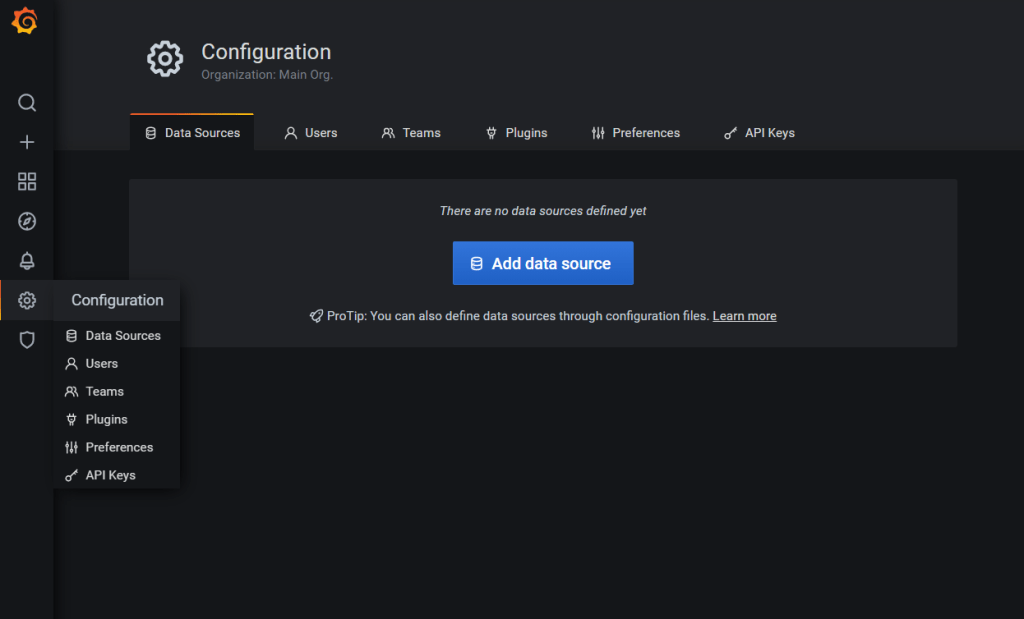
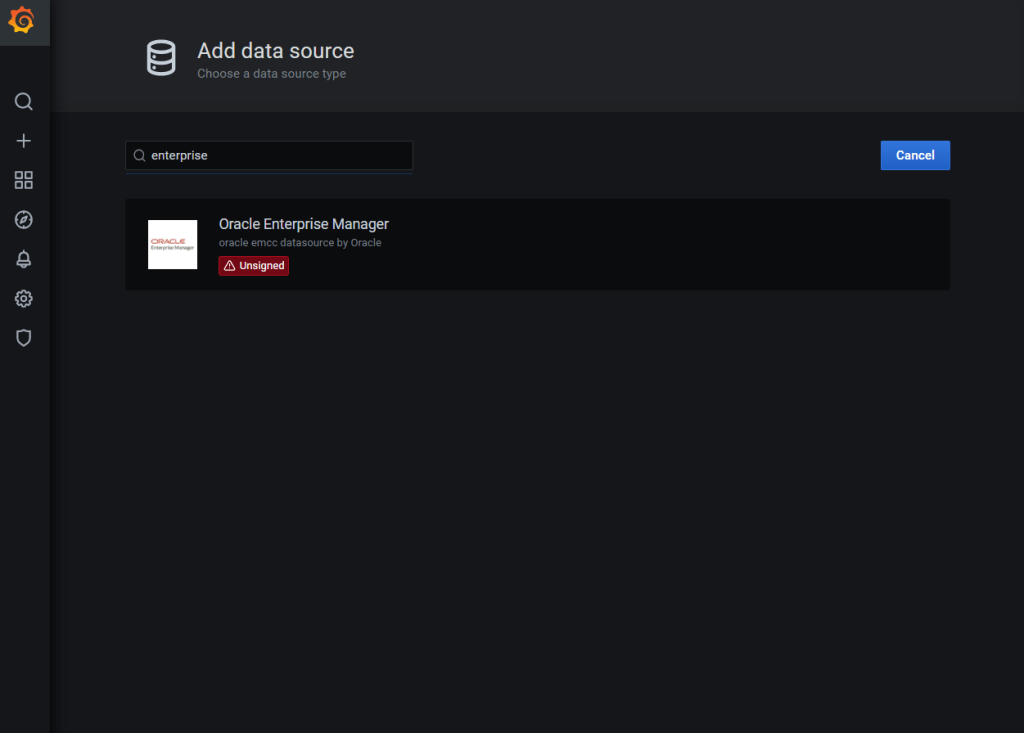
6.6 Search for Oracle Enterprise Manager
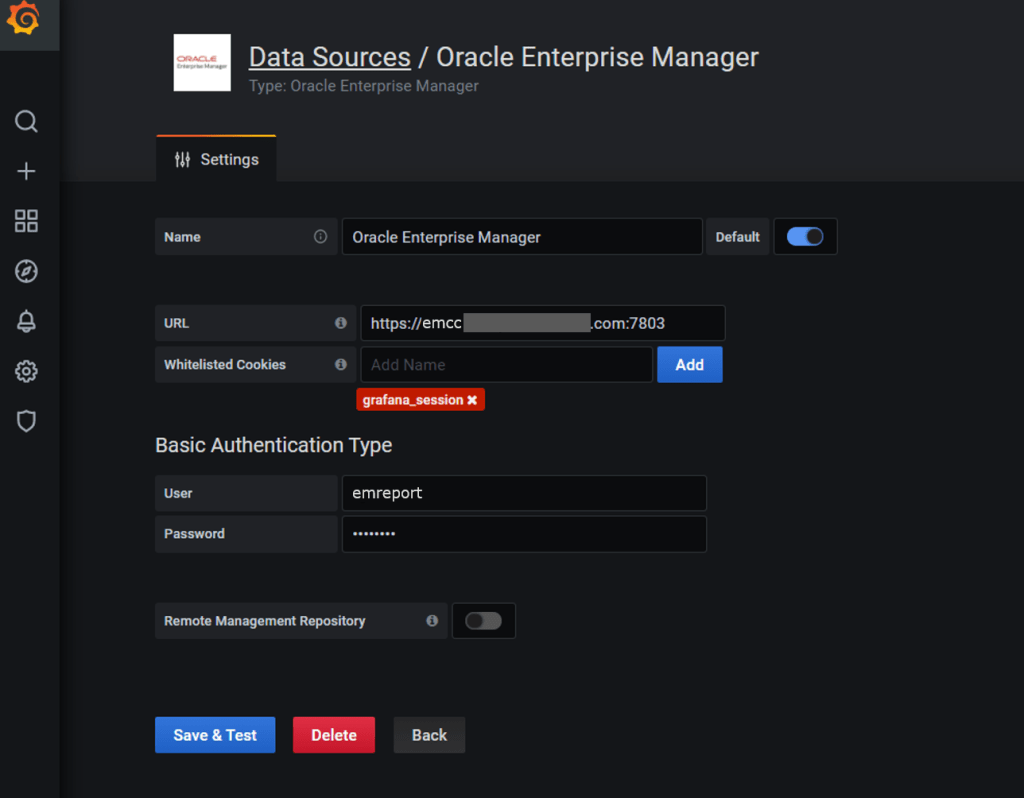
6.7 Configure the Data Source of your EM configuration
NOTE: Avoid connecting with SYSMAN user, configure an EM administrator (eg. EMREPORT) that has access to all views in the EM REPOSITORY
7 – ACCESS DASHBOARD
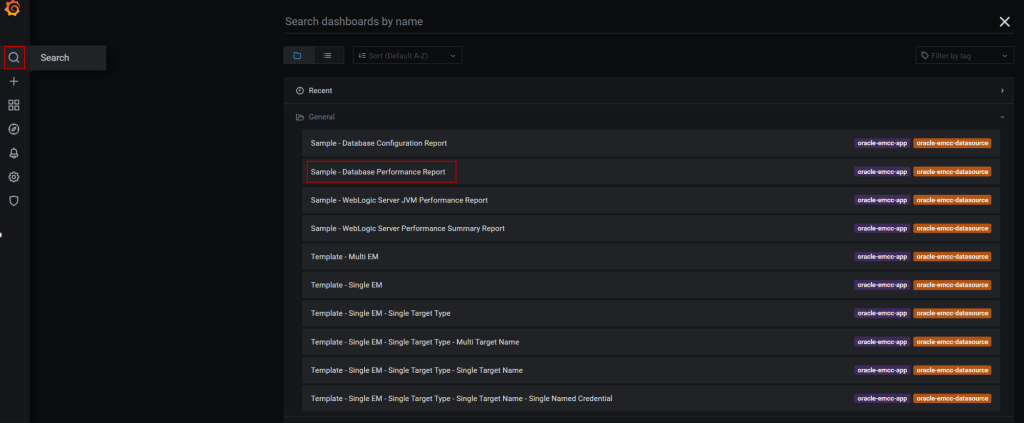
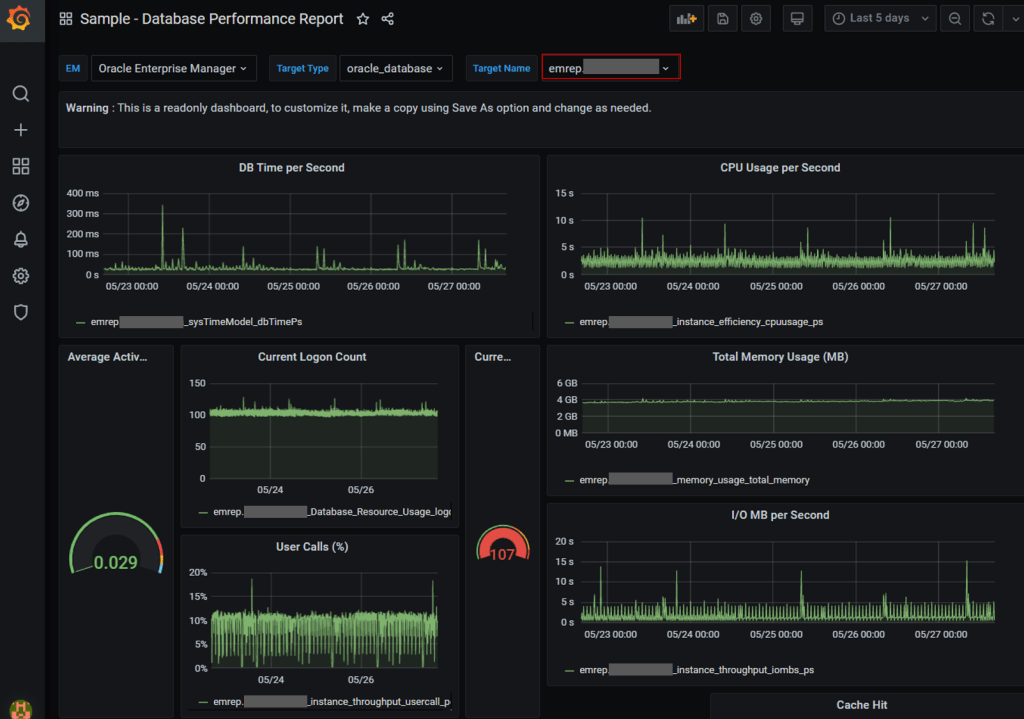
7.1 From menu, navigate to Search and then choose an out of box dashboard from list eg. Sample – Database Performance Report
7.2 Select Target Name = eg. emrep
7.2 For viewing multiple targets, select Target Name = eg. emrep, finance, hr, sales
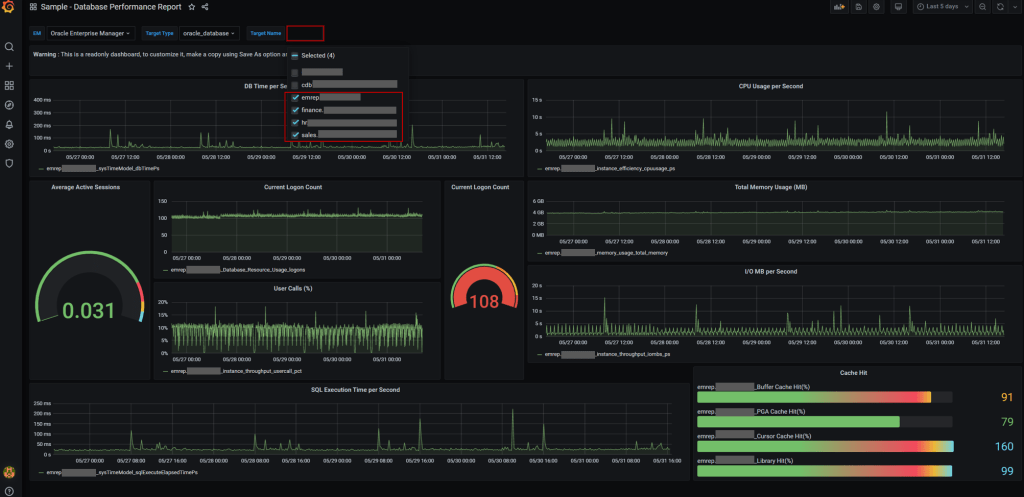
Now you be able to see performance report of multiple targets in one view
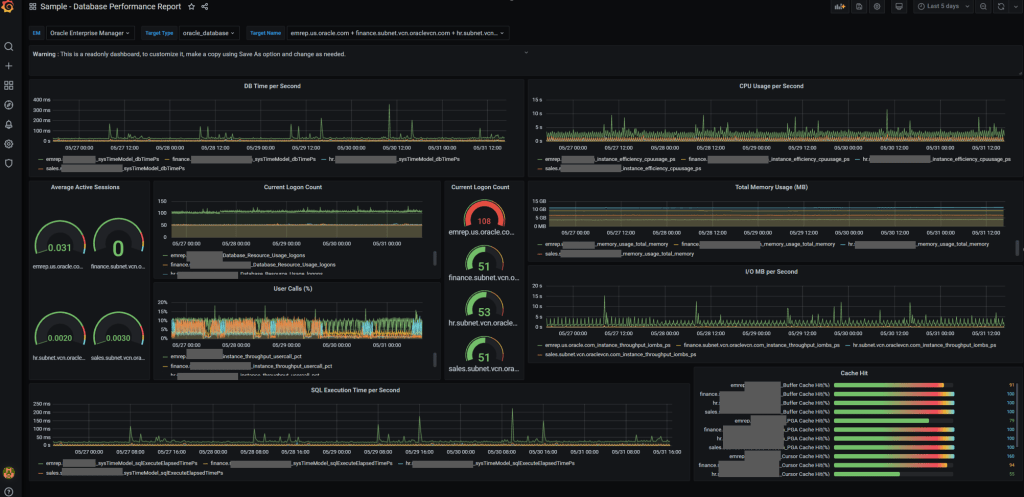

cool!!!
LikeLike