
Sometimes it is necessary to monitor specific processes that are not in the provided OMC processes list and this is where CUSTOM METRIC come into the scene.
In this short post I will show how to create a CUSTOM METRIC and ALERT RULE to manage it.
So the challenge of the day: Monitor custom windows / linux process and if it stops giving signs of life alert to the support group.
Pre-work: Cloud Agent for Windows pre-installed on my laptop (some documentation on this can be found here: https://docs.oracle.com/en/cloud/paas/management-cloud/emaig/install-cloud-agents.html)
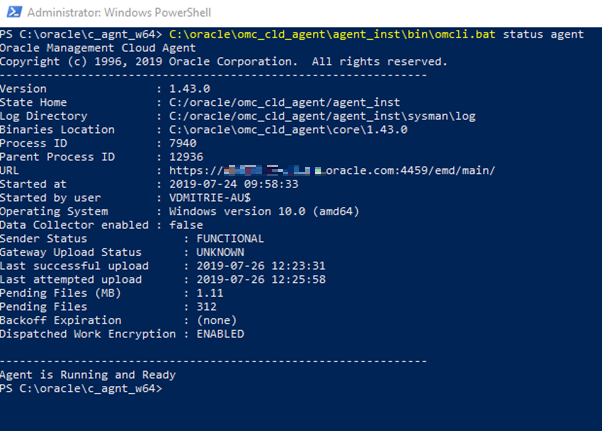
UP and RUNNING as above…
Next step is to create a custom shell script (can be windows or linux,) in my case it is windows processAuditor.bat just returning number of the processes with a process name given as a parameter (example is below)
———————————————————–
@echo off
REM Get the number of the processes and return number of the Process(s) more then ZERO or 0 – not running.
FOR /F “tokens=* USEBACKQ” %%g IN (`tasklist /fi “imagename eq %1” ^| find /c “%1″`) do (SET “NumOfProcesses=%%g”)
IF /I “%NumOfProcesses%” EQU “0” (ECHO 0) ELSE (ECHO %NumOfProcesses%)
exit
———————————————————–
PLEASE NOTE: Be careful with return code of the your schell scripts (like: %errorlevel% (window)). Return status should not be failure otherwise OMC will stop accepting data.

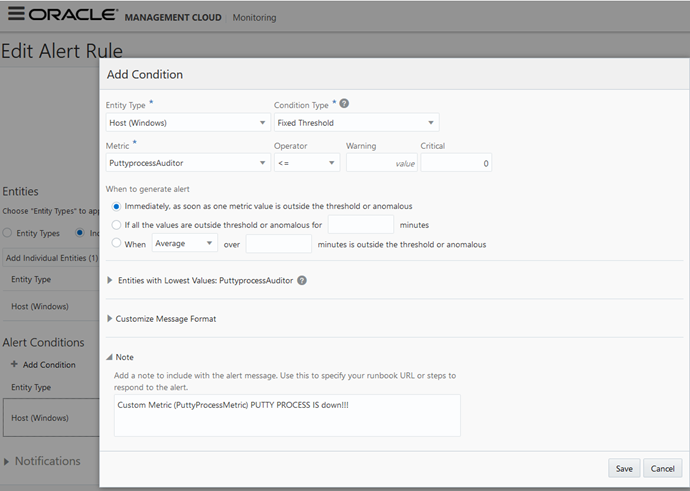
Test case: There is one PUTTY.EXE windows process that is running. Generate an Alert in case the number of putty processes drops to 0 (Zero).
Official Doc link: https://docs.oracle.com/en/cloud/paas/management-cloud/moncs/expand-monitoring-capability-custom-metrics.html
Navigation: > Go to OMC console > Home > Monitoring > Monitoring Admin
Create a CUSTOM METRIC like:
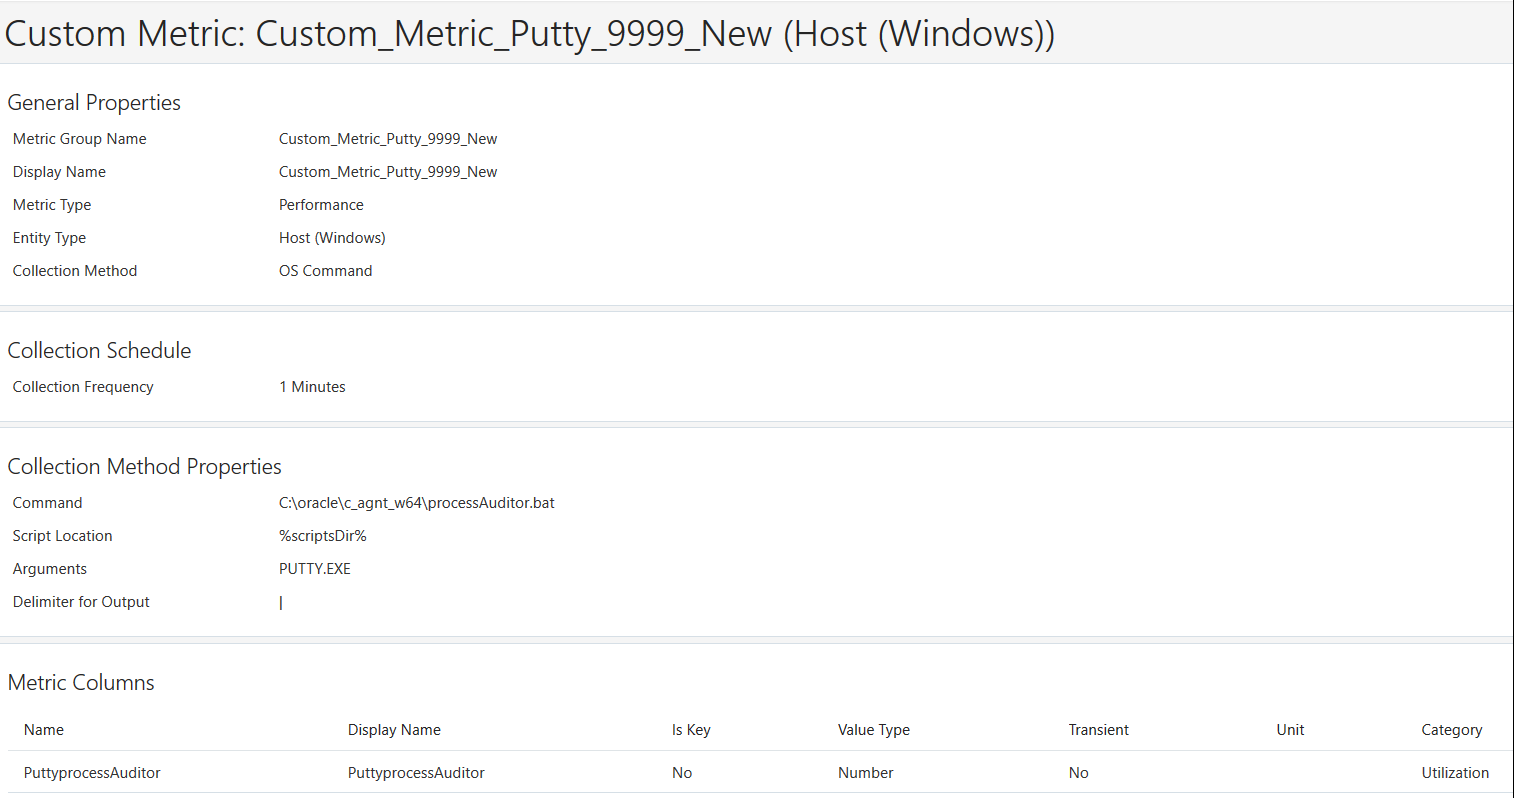
Once “Submitted” test it. IMPORTANT: DO NOT use your browser’s refresh/reload function or navigate away from this page and apply “Refresh Every Minute”, click to Success to verify expected result.
Click on Custom Metric, select the newly created one, Publish and Deploy to the Monitoring Entity. Deployment status after In Progress, should be Success (IMPORTANT: DO NOT use your browser’s refresh/reload function or navigate away from this page apply “Refresh Every Minute”).
Now back to the Entity Monitoring and add new Custom Metric (in this case PuttyProcessMetric) to the Performance Charts

Now it’s time to create Alert: Alerts > Alert Rules > Service (select Monitoring) > +Create Alert Rule
Example:
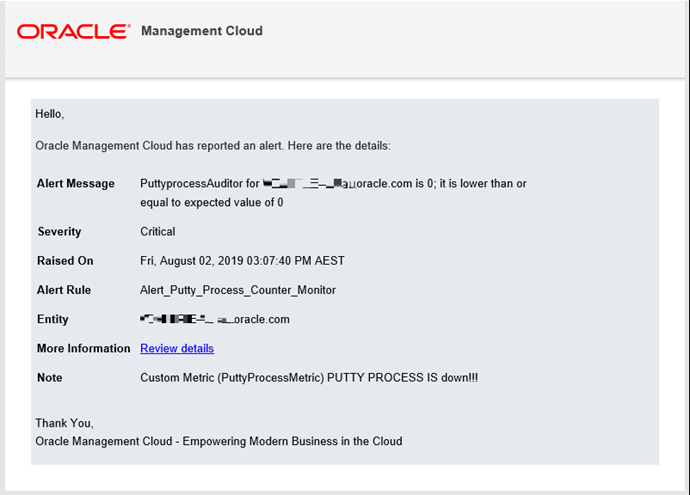
Once ALL putty process(es) are terminated, a new Alert is received.
All DONE!

One thought on “OMC Custom Metric – empowering custom monitoring”