
The Oracle Cloud Application Performance Monitoring (APM) service collects end user trace sessions for Real User Monitoring (RUM). By default the client IP is not captured for the end user session. For some customers, default Geolocation info (eg. Country, Region, City) may be sufficient for end user monitoring. However, for those who want to collect Client IP information as well, to enable this setting please see the following example.
Enable Client IP Collection for End User Session
For every End User Session, we want to capture the Client IP address location.
1. To do this, in the OCI Console, navigate to the OCI APM Service
OBSERVABILITY & MANAGEMENT > APPLICATION PERFORMANCE MONITORING > ADMINISTRATION
2. Then navigate to:
APM DOMAINS > [Select APM Domain eg. psft_app] > Span Enrichment > Global Settings
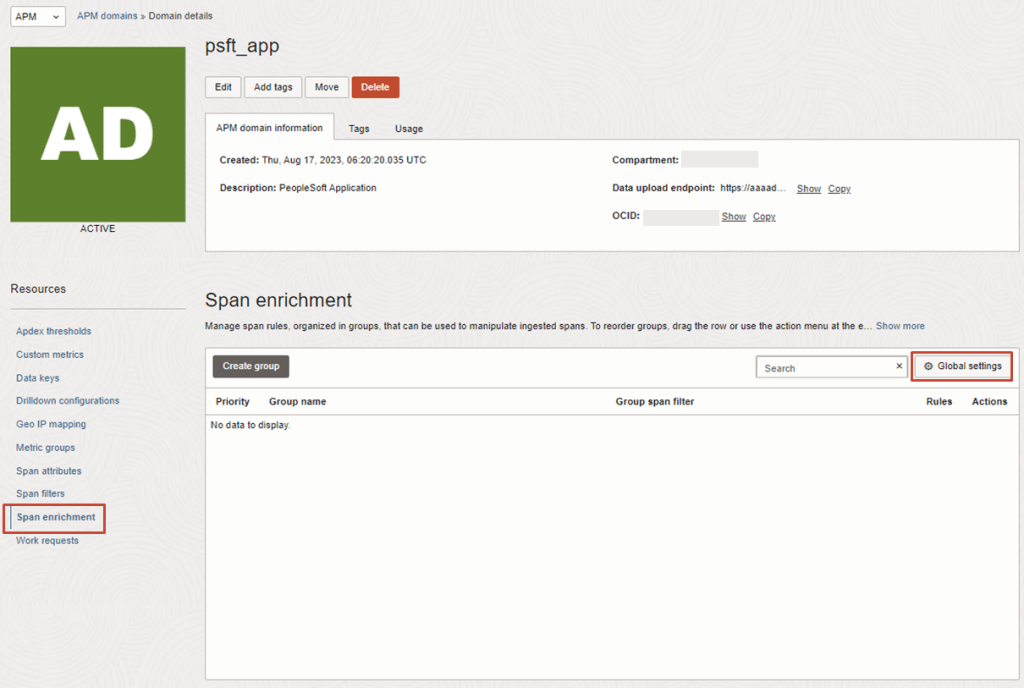
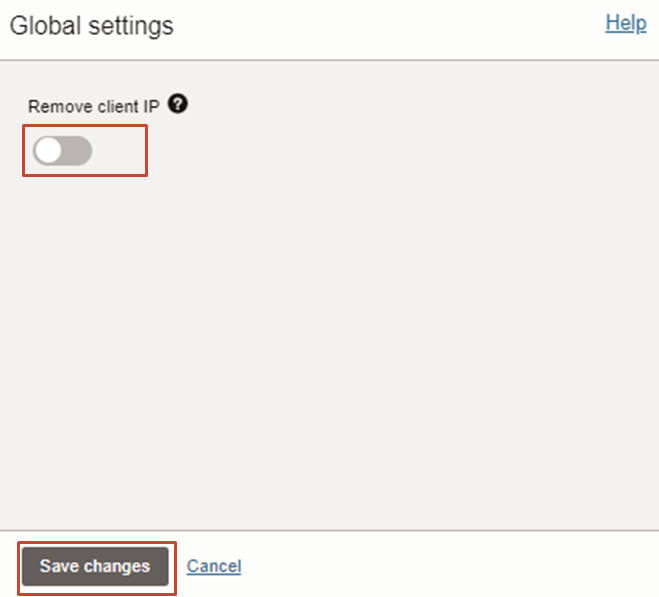
3. As shown here, make sure the toggle is set as below to disable the “REMOVE CLIENT IP” setting.
4. Create Span Filter by navigating to:
SPAN FILTERS > CREATE FILTER

5. Enter inputs for Span Filter:
Name: Browser_Filter
Pages: Component=’BROWSER’
Description: This is to capture IP details for Browser End User

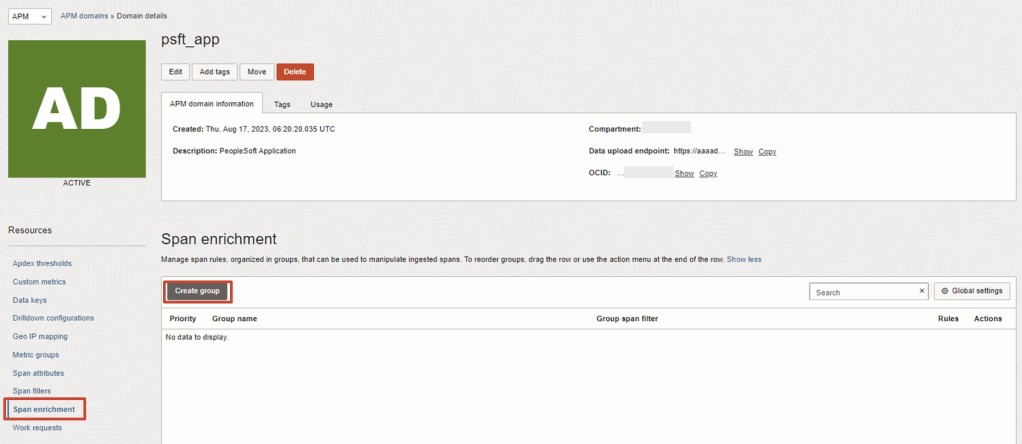
6. Create Span Enrichment Rule Group
SPAN ENRICHMENT > CREATE GROUP
7. Enter the inputs for Span Rule Group to Create Group Info
Group Name: Browser_Filter_Group
Group Span Filter: Browser_Filter
Description: Browser Filter Group for Span Filter Browser_Filter
Enabled: True
Click on Next

8. Enter the inputs for Span Rule Group to Configure Rule Action
IP_Capture: Oracle provided span rule
Rule name: IP_Capture
Rule Description: IP details captured for Browser End User
Oracle Provided Rule:
Adds the client IP address to span
Click on Finish

9. From APM Domain page, go to the Trace Explorer

10. In Trace Explorer, enter the following query to verify IP address is being collected for user sessions, in the last hour
show spans component, count_distinct(username),count_distinct(clientIp), count_distinct(geocountry), count_distinct(geocity), min(reportPeriod), max(reportPeriod) where component in ('BROWSER','SERVLET') group by component order by max(reportPeriod) desc
Tip: If no data is shown here, generate some traffic in the targeted application that is being monitored, by logging in as an end user.
11. Go to Sessions tab, then drill down to Show Traces for a target user session.
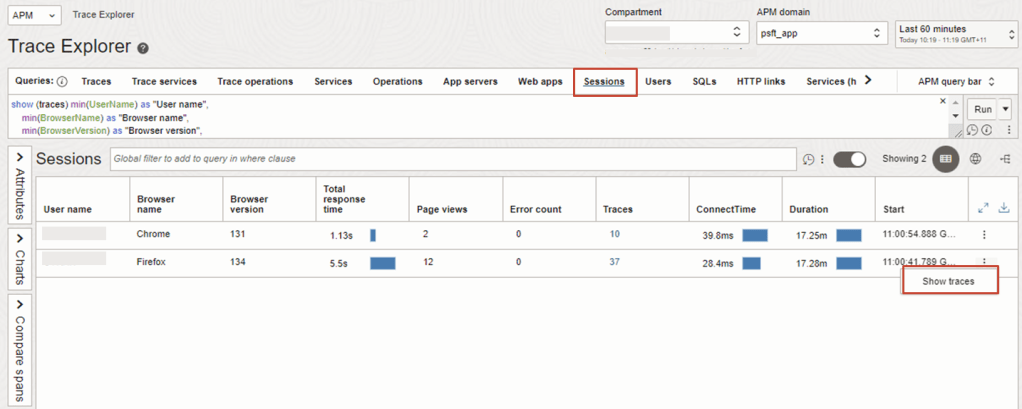
Tip: If no data is shown here since the time you had applied the change to capture IP collection, generate some traffic in the targeted application that is being monitored by logging as an end user. Only new sessions from when change was applied will have client IP captured.
12. Then choose a trace and then drill down to Trace Details

13. Click on any of Span listed for further details

14. Enter in search bar to filter on clientIp attribute.
This should now confirm the client IP address has been collected for end user.

15. By default Geolocation information (eg. Country, Region and City) is collected. However, for a more precise reporting on Geolocations, the Geo IP Mapping can be further configured as per documentation.
