It provides deep visibility into the application performance from end-user experience down through to the application server requests.
For many customers, the PeopleSoft (PSFT) Application is critical to business operations. With OCI Application Performance Monitoring (APM) service, administrators can:
Analyze all end user experience with accessing PeopleSoft web pages.
Trace transactions across various components and isolate problems to the impacting application or infrastructure tier.
Has ability to drill into application code.
Generally, APM tools cannot drill into the SQL code for the PeopleSoft application. This inability occurs is because, the SQL call is performed in the Tuxedo layer. However, OCI APM service offers a unique feature to overcome this limitation. It can perform instrumentation of outbound JOLT calls from WebLogic to Tuxedo. This helps at least understand how much time is spent in this layer.
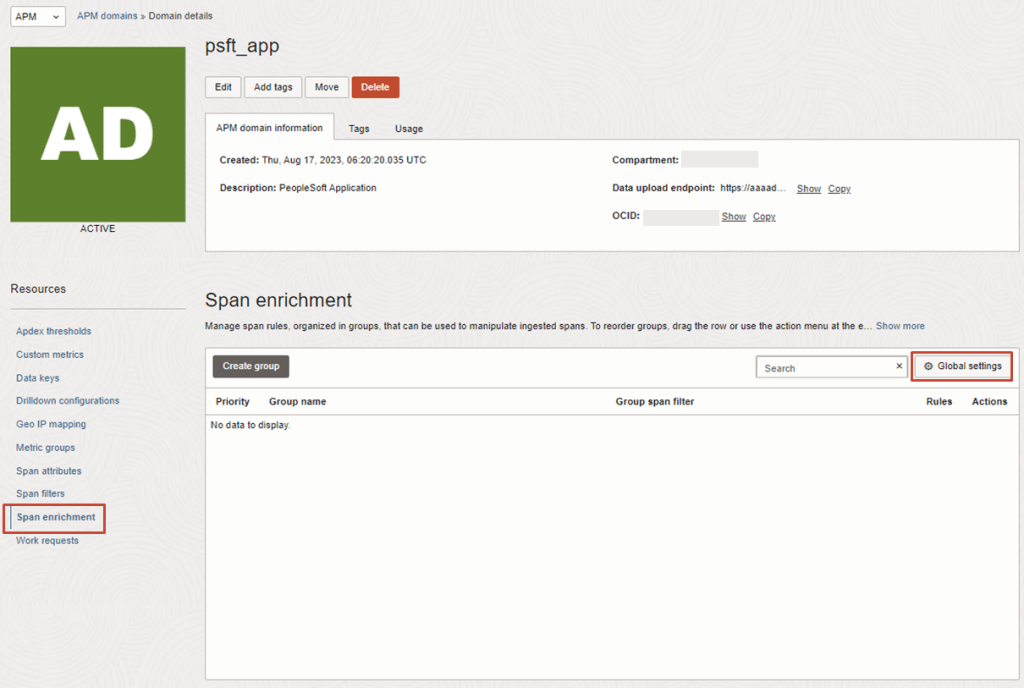
Easily Capture End Username for user sessions without modifying application code
Search in context based on PeopleSoft attributes including: – Portal Name – Portal Object Name – and more
The OCI Application Performance Monitoring (APM) service allows administrators to monitor and observe the E-Business Suite web applications.
It provides deep visibility into the application performance from end-user experience down through to the application server requests.
For many customers, the E-Business Suite (EBS) Application is critical to business operations. With OCI Application Performance Monitoring (APM) service, administrators can:
Analyze all end user experience with accessing EBS web and form pages.
Trace transactions across various components and isolate problems to the impacting application or infrastructure tier.
Has ability to drill into application code and SQL calls to the database
Easily Capture End Username for user sessions without modifying application code
To search in context, you can use out of box EBS attributes auto generated from traces. These attributes include: – EBS Function Name – EBS Class Package Name – EBS Forms Name – and more ….
The Oracle Cloud Application Performance Monitoring (APM) service collects end user trace sessions for Real User Monitoring (RUM). By default the client IP is not captured for the end user session. For some customers, default Geolocation info (eg. Country, Region, City) may be sufficient for end user monitoring. However, for those who want to collect Client IP information as well, to enable this setting please see the following example.
Enable Client IP Collection for End User Session
For every End User Session, we want to capture the Client IP address location.
1. To do this, in the OCI Console, navigate to the OCI APM Service
OCI gives you flexibility to create custom metrics when no out of box metrics are available. There are two options on how this can be achieved. Depending on your use case let’s take a look at which choice works for you.
Requirements
OCI Monitoring Service
OCI Stack MonitoringService
View Metrics in Monitoring Service
Yes
Yes
Create Alarms
Yes
Yes – Automatically, emitted to Monitoring Service once Metric Extension is enabled for target resource
Metric Dimensions
Yes
Yes
Frequency Collection
Control by client API execution, cron job, scheduler or agent
Yes – can be configured when creating the metric extension.
Collection can be directly executed by OS command, Script(eg. Shell, Python), SQL, JMX or HTTP (REST API)
With the recent announcement from Gartner Magic Quadrant Report, it’s no surprise that Oracle Integration Cloud (OIC) is the Leader in Data Integration.
As a result, we have seen an explosion of demand for the service over the past 12 months. What we have seen is that many customers have been reaching out to my colleague @lsiliver and myself across APAC (Asia Pacific) and we are seeing that OIC customers want observability and deeper insights into their integration processes, data pipelines, workflows, automation and services.
So, in this blog post, we will walk you through this scenario on how you can get started on achieving this.
Many customers may not be aware but we already have existing native integration capabilities for OIC with our Observability & Management platform.
In the world of cloud computing there are often multiple ways to achieve the same or similar result. In Oracle Cloud Infrastructure (OCI) logs are generated by the platform itself such as audit logs, OCI native services such as the Network Firewall Service, and custom logs from compute instances or your applications. These logs typically live in OCI logging where you can view them, or search them if required.
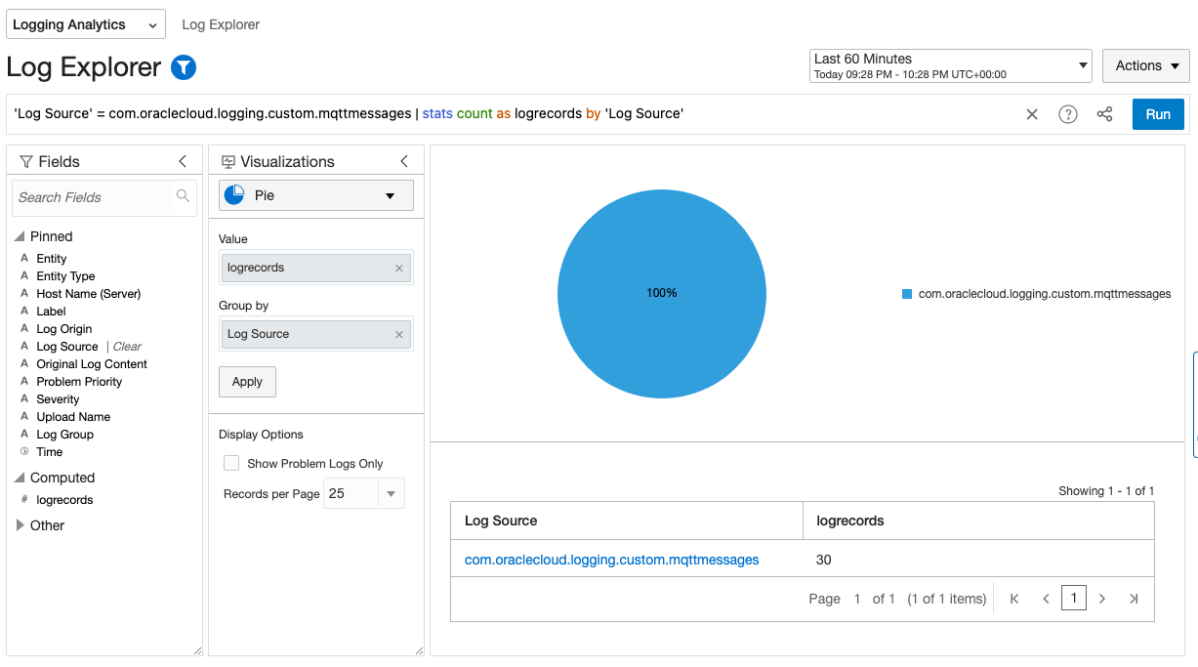
Collecting and storing logs is useful, however if you want to produce insights then you will need a way to analyse and visualise the log data. OCI Logging Analytics allows you to index, enrich, aggregate, explore, search, analyse, correlate, visualise and monitor all log data from your applications and system infrastructure.
From OCI logging there are two common ways in which logs can be ingested into Logging Analytics. The first is using a Service Connector to send logs to an Object Storage bucket, and an Object Collection Rule to then import the logs into Logging Analytics. The second option uses a Service Connector to send the logs directly to Logging Analytics. Both are valid options however require some consideration before use.
If you are running Oracle E-Business Suite (EBS) application today you will now be able to perform an auto discovery of all related resources in OCI Stack Monitoring. It will collect metrics specific for your EBS resources as well as ability to perform correlation across the EBS application and infrastructure stack as well as enable proactive alerting.
Components that will be auto discovered includes:
Concurrent Processing Node
Workflow Manager
WebLogic
Forms
Today, Stack Monitoring service supports EBS version 12.1 and 12.2 deployments hosted on OCI, On-Premise or Third Party Cloud (eg. AWS, Azure).
In the example, I will show you how you can configure Stack Monitoring for EBS version 12.2.
Oracle Cloud Agent (OCA) – This agent is deployed by default if you provision hosts via the OCI Compute Service. OCA has extensions and plugins which can be used to enable other features native to OCI Compute Services.
Management Agent (OMA) – This agent is a standalone version where you can deploy to hosts or VMs: – That do not have OCA installed on OCI eg. OCI Database Services (eg. Oracle Base VM/BM, ExaCS). – On-Premise – Third Party Cloud (AWS, Azure etc..)
…
Please see the current O&M support we have for each agent:
OCI Agent
Logging Analytics
Stack Monitoring
Database Management
Operations Insights
Target
Oracle Cloud Agent (OCA)
Yes
Yes
Yes
OCI Compute VM / BM Host
Oracle Management Agent (OMA)
Yes
Yes
Yes
Yes
Other VM Host (including on-premise and 3rd party cloud)
OMA Agent Install
In previous post, I have provided steps on how you can install the Oracle Management Agent.
OCA Agent Install
For this post, let me show you how easy it is to enable the O&M services for Oracle Cloud Agent (OCA).
If you’re like me, then working in IT means you also assume Tech Support duties for friends, family, and those distant relatives that only seem to call when they’ve got a problem.
I just clicked on this link, and my computer is doing something weird. I think my PC has a virus, what do I do?
When it’s just a single computer, the answer is simple, contain and validate the rouge software is removed, install an AV solution, change their passwords, enable MFA, and provide some education on what to look out for next time.
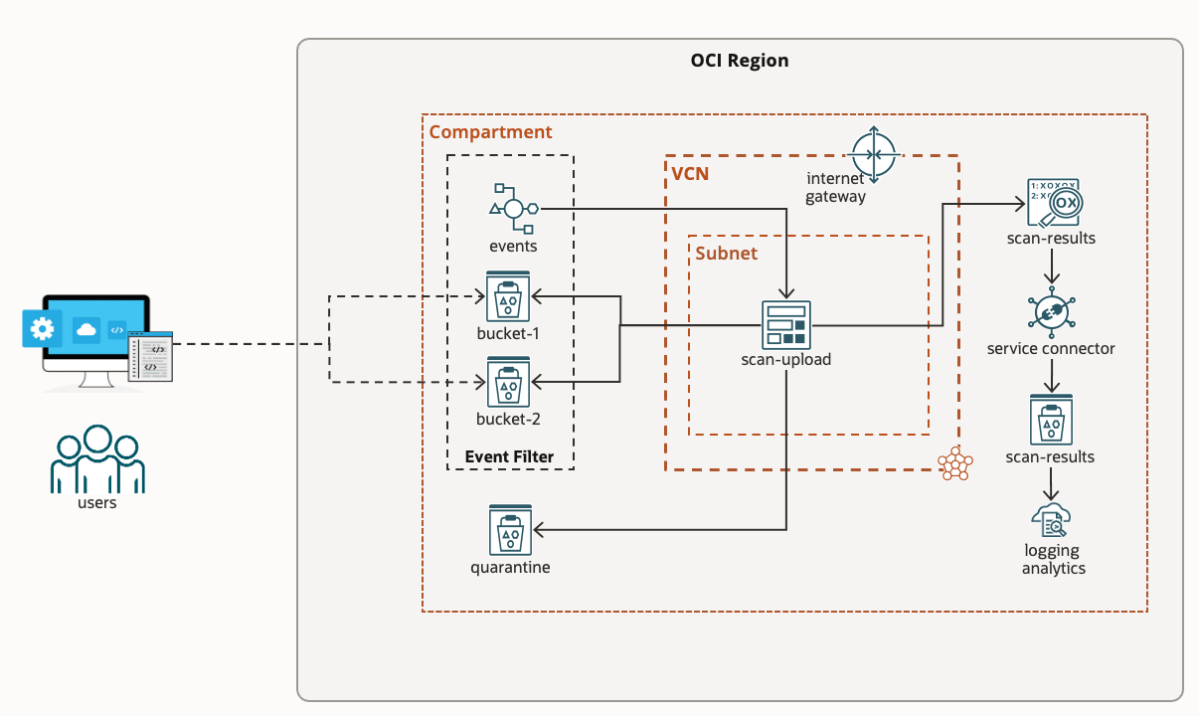
But now imagine you’re an organisation building a new application, or are moving applications to the cloud. Are you simply performing a lift-and-shift or are you planning to make use of cloud native services? Where are you going to store your data, specifically user uploaded files? Object Storage was built specifically to solve the challenges of how to store unstructured data in the cloud.
However, there is a catch. If you were previously storing files on a server file system, then it’s likely you were also running an anti-virus / anti-malware solution to identify malicious files. With Object Storage the underlying file system is transparent, so you can’t install AV, yet many compliance requirements still state “Uploaded files must be scanned for viruses and malware”.
I’m sure we can all agree, adopting a cloud strategy is awesome. The opportunities and benefits it affords are many. However cloud governance is an ongoing problem that plagues security, compliance, and management teams, which cloud vendors like Oracle are continually trying to solve.
If you’re reading this, you’ve probably been asked, or heard at least once:
Who has access to what in our environment?
Any Security / Compliance Manager
The answer should be easy and simple. However the reality is likely lots of manual time & work, spreadsheets, and endless clicking in a cloud console. If you’re doing this manually then I agree, it’s time that you could be dedicating to more important tasks.
The challenge in trying to answer these questions:
What users exist and what groups do they belong to?
What does my OCI tenancy compartment structure look like?
What policies have users explicitly created?
What permissions do users have in my tenancy?
Are there any excessive / non-compliant policies & permissions in my tenancy?
is that these complex relationships can’t be easily represented and interpreted in a table-like format. In the OCI ecosystem:
users can be federated with an Identity Provider and can belong to one or many federated, or local IAM groups,
policies can be defined for “any-user” or for a group,
policies are inherited meaning they apply to all sub-compartments from which the policies are applied.
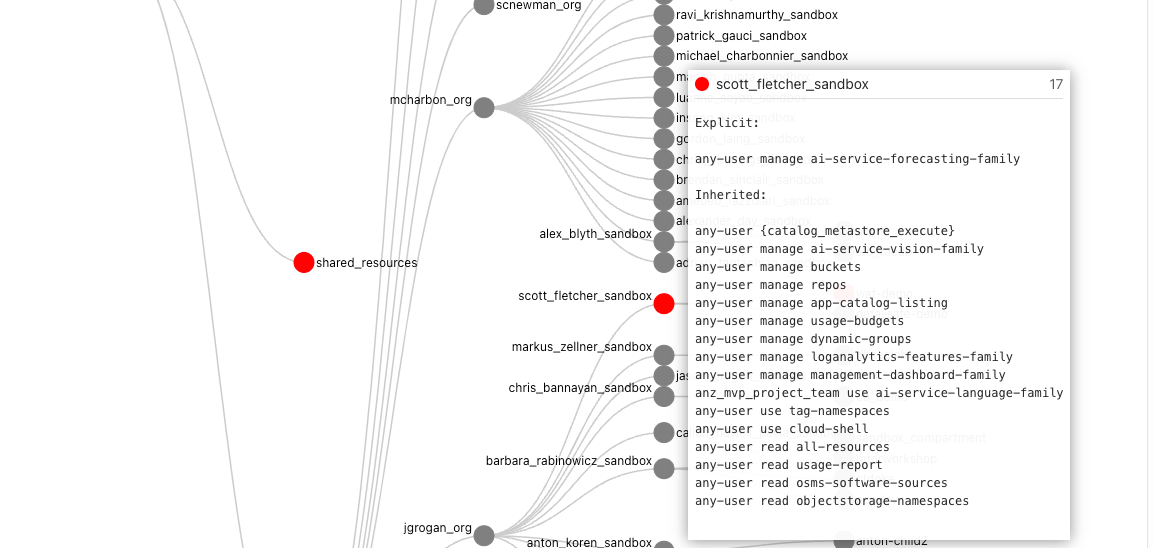
To make things easier I’ve created a solution using Oracle tools and services to simplify the auditing of OCI tenancies and user permissions called “Peek”.
Note: From 22/05/2023 APEX is no longer required as the solution runs entirely inside the container. To run the new container for OCI with IDCS use the following command:
docker run -it --name peek --rm \
--mount type=bind,source=/Full/Path/To/.oci/,target=/root/.oci/,readonly \ -e OCI_PROFILE_NAME=<from your OCI config> \-e OCI_TENANCY_OCID=<from text file> \
-e OCI_IAM_URL=<from text file> \
-e IDCS_URL=<from text file> \
-e IDCS_CLIENT_ID=<from text file> \
-e IDCS_SECRET=<from text file> \-e TOOLTIP_LINE_PX=20 \
-p 4567:4567 \scottfletcher/oci-peek
After the docker container has started, you can access the web interface using the locally mapped port http://localhost:4567. You should see a progress window:
Once the mapping process is complete the visualisation will appear.
Depending on how long your policy statements are, you may wish to adjust TOOLTIP_LINE_PX to a number greater or smaller than 20. If your policy statements overflow the tooltip box then increase this value, or if the box is too big, then you can decrease this value.
If you haven’t run Peek before, please read on as I explain how to create the required credentials and where to obtain the values for the other environment variables. You can skip the APEX steps, as APEX will not be used.