Deploying OCI APM Service for Optimal EBS Application Observability


The OCI Application Performance Monitoring (APM) service allows administrators to monitor and observe the E-Business Suite web applications.

It provides deep visibility into the application performance from end-user experience down through to the application server requests.

For many customers, the E-Business Suite (EBS) Application is critical to business operations. With OCI Application Performance Monitoring (APM) service, administrators can:

  • Analyze all end user experience with accessing EBS web and form pages.
  • Trace transactions across various components and isolate problems to the impacting application or infrastructure tier.
  • Has ability to drill into application code and SQL calls to the database
  • Easily Capture End Username for user sessions without modifying application code
  • To search in context, you can use out of box EBS attributes auto generated from traces. These attributes include:
    – EBS Function Name
    – EBS Class Package Name
    – EBS Forms Name
    – and more ….
Continue reading “Deploying OCI APM Service for Optimal EBS Application Observability”

How To Capture Client IP in OCI Application Performance Monitoring

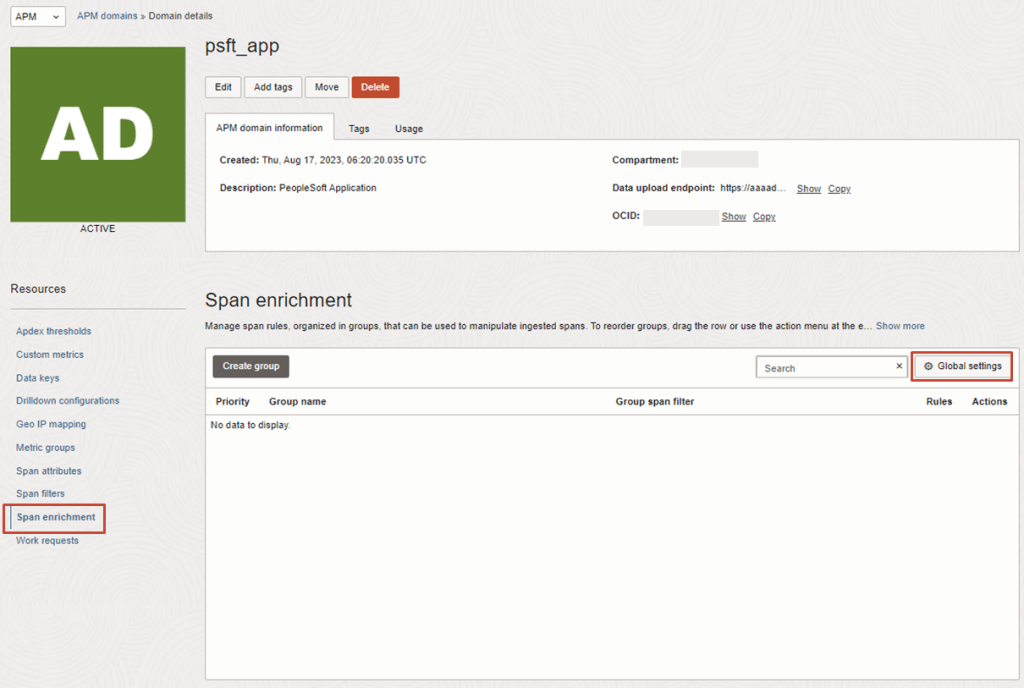
The Oracle Cloud Application Performance Monitoring (APM) service collects end user trace sessions for Real User Monitoring (RUM). By default the client IP is not captured for the end user session. For some customers, default Geolocation info (eg. Country, Region, City) may be sufficient for end user monitoring. However, for those who want to collect Client IP information as well, to enable this setting please see the following example.

Enable Client IP Collection for End User Session

For every End User Session, we want to capture the Client IP address location.

1. To do this, in the OCI Console, navigate to the OCI APM Service

OBSERVABILITY & MANAGEMENT > APPLICATION PERFORMANCE MONITORING > ADMINISTRATION

2. Then navigate to:
APM DOMAINS > [Select APM Domain eg. psft_app] > Span Enrichment > Global Settings

Continue reading “How To Capture Client IP in OCI Application Performance Monitoring”

Guide to OCI Custom Metrics and Monitoring Options

OCI gives you flexibility to create custom metrics when no out of box metrics are available. There are two options on how this can be achieved. Depending on your use case let’s take a look at which choice works for you.

RequirementsOCI Monitoring Service OCI Stack Monitoring Service
View Metrics in Monitoring Service
YesYes
Create AlarmsYesYes – Automatically, emitted to Monitoring Service once Metric Extension is enabled for target resource
Metric DimensionsYesYes
Frequency CollectionControl by client API execution, cron job, scheduler or agentYes – can be configured when creating the metric extension.
Collection can be directly executed by OS command, Script(eg. Shell, Python), SQL, JMX or HTTP (REST API) Custom Metrics can be published using OCI CLI or REST APIYes – Use Metrics Extensions
Centrally manage Custom Metrics for single or multiple resources – Enable, Clone, Export/ImportYes
Define collection based on Resource Types (eg. apache_http_server, apache_tomcat, oci_oracle_db, ebs_instance, host_linux, host_windows, miscrosoft_iis, sql_server etc…)Yes
Baseline and Anomaly detection in Metrics using ML based algorithms Yes
Perform correlation across multiple metricsYes
Apply Metric Extension lifecycle phases: Test and Validate, PublishYes
Custom Metric Collection from OCI, on-premise and/3rd party CloudYesYes
Alert against log data from OCI Logging AnalyticsYes – The Detection Rule needs to be created in OCI Logging Analytics
Custom Metric collection using Prometheus Exporter YesYes
Continue reading “Guide to OCI Custom Metrics and Monitoring Options”

Ingesting Logs into OCI Logging Analytics (via Agent Based Deployment)

Logs are often voluminous can be challenging to navigate through, but it can be a gold mine of valuable data to help administrators troubleshoot and identify issues or trends for operational activities.

To overcome the burden of manually eye-balling millions or (even billions) of rows in log records, bringing that data into OCI Logging Analytics (which is part of the Observability & Manageability Portfolio) will allow administrators to get quick insights, to reduce the time to isolate issues, minimising downtime and prevent impact to end users.

Continue reading “Ingesting Logs into OCI Logging Analytics (via Agent Based Deployment)”

Getting Insights with OCI Audit Log with Logging Analytics (via Service Connector)

Recently Clay Magouyrk, EVP of Oracle Cloud Infrastructure engineering announced the new Oracle Cloud Observability and Management Platform.

The new platform will provide OCI native integration to provide operational insights into our OCI services in addition to previous capabilities available in Oracle Management Cloud. Logging Analytics is the first major Oracle Management Cloud Service to be incorporated, and so my fellow colleague @callanhp and I were itching to give it a go and see how we could implement it, so we chose the most available logs we could think of, the audit logs from the OCI control plane.

In this blog we will discuss the mechanics for forwarding OCI Audit Logs to the Logging Analytics service from the Oracle Cloud Observability and Management platform, and discuss how this pattern can be extended to other log sources.

Continue reading “Getting Insights with OCI Audit Log with Logging Analytics (via Service Connector)”