How To Capture Client IP in OCI Application Performance Monitoring

The Oracle Cloud Application Performance Monitoring (APM) service collects end user trace sessions for Real User Monitoring (RUM). By default the client IP is not captured for the end user session. For some customers, default Geolocation info (eg. Country, Region, City) may be sufficient for end user monitoring. However, for those who want to collect Client IP information as well, to enable this setting please see the following example.

Enable Client IP Collection for End User Session

For every End User Session, we want to capture the Client IP address location.

1. To do this, in the OCI Console, navigate to the OCI APM Service

OBSERVABILITY & MANAGEMENT > APPLICATION PERFORMANCE MONITORING > ADMINISTRATION

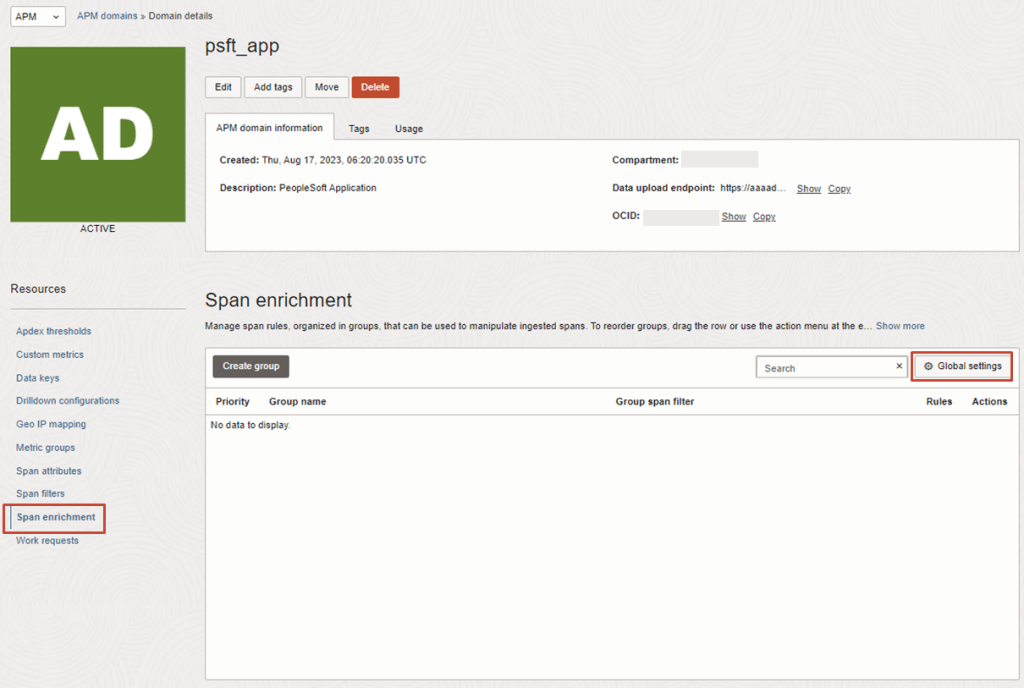
2. Then navigate to:
APM DOMAINS > [Select APM Domain eg. psft_app] > Span Enrichment > Global Settings

Continue reading “How To Capture Client IP in OCI Application Performance Monitoring”

Guide to OCI Custom Metrics and Monitoring Options

OCI gives you flexibility to create custom metrics when no out of box metrics are available. There are two options on how this can be achieved. Depending on your use case let’s take a look at which choice works for you.

RequirementsOCI Monitoring Service OCI Stack Monitoring Service
View Metrics in Monitoring Service
YesYes
Create AlarmsYesYes – Automatically, emitted to Monitoring Service once Metric Extension is enabled for target resource
Metric DimensionsYesYes
Frequency CollectionControl by client API execution, cron job, scheduler or agentYes – can be configured when creating the metric extension.
Collection can be directly executed by OS command, Script(eg. Shell, Python), SQL, JMX or HTTP (REST API) Custom Metrics can be published using OCI CLI or REST APIYes – Use Metrics Extensions
Centrally manage Custom Metrics for single or multiple resources – Enable, Clone, Export/ImportYes
Define collection based on Resource Types (eg. apache_http_server, apache_tomcat, oci_oracle_db, ebs_instance, host_linux, host_windows, miscrosoft_iis, sql_server etc…)Yes
Baseline and Anomaly detection in Metrics using ML based algorithms Yes
Perform correlation across multiple metricsYes
Apply Metric Extension lifecycle phases: Test and Validate, PublishYes
Custom Metric Collection from OCI, on-premise and/3rd party CloudYesYes
Alert against log data from OCI Logging AnalyticsYes – The Detection Rule needs to be created in OCI Logging Analytics
Custom Metric collection using Prometheus Exporter YesYes
Continue reading “Guide to OCI Custom Metrics and Monitoring Options”